


INTRODUCTION
Metabolic syndrome (MetS), a multiplex risk factor for cardiovascular disease [1] and insulin resistance (IR), a fundamental cause of metabolic disturbances including type 2 diabetes, are interconnected with decreased skeletal muscle mass.[2] Several studies have reported a favorable relationship of skeletal muscle mass with MetS,[3,4] the components of MetS, and an IR indicator such as homeostatic model assessment for IR (HOMA-IR).[5]
In addition to the effects of aging, environmental factors may play an important role in the reduction of skeletal muscle mass and development of MetS and IR.[1,6] Among environmental factors, food security related to nutritional intake may be involved in the interrelationship between skeletal muscle mass, MetS, and IR. Lower food security, which refers to the state in which safe and sufficient food cannot be secured for the healthy life of household members,[7,8] may be linked to loss of skeletal muscle mass and increase in adiposity because lower food security has been associated with lower dietary quality [9] and compensatory reliance on energy-dense and nutrient-poor foods, as well as energy-poor and nutrient-poor foods.[10,11]
However, the evidence for whether food security moderates the relationship between skeletal muscle mass, MetS, and IR is unclear. Although the results of previous studies on the relationships of food security with sarcopenia,[12-15] MetS,[16-18] and IR [19] were inconsistent, there is evidence to support that food security was associated with sarcopenia, MetS, and IR.[13,14,16,19] In addition, the associations of sarcopenia with MetS and IR are well established.[5,20] However, it is unclear if the level of food security has an effect on these relationships. The strength of the associations of skeletal muscle mass with MetS and IR may vary depending on the level of food security in the household. Therefore, the hypothesis of this study assumes that the relationships of skeletal muscle mass with MetS and IR will be affected by food security levels. The importance of availability of high-quality, nutritious food will be reaffirmed by investigating whether household food security influences the associations between skeletal muscle mass and MetS and IR. As a result, it was investigated whether the relationships of skeletal muscle mass with MetS and IR were modified by household food security in this study utilizing Korean representative data.
METHODS
1. Subjects
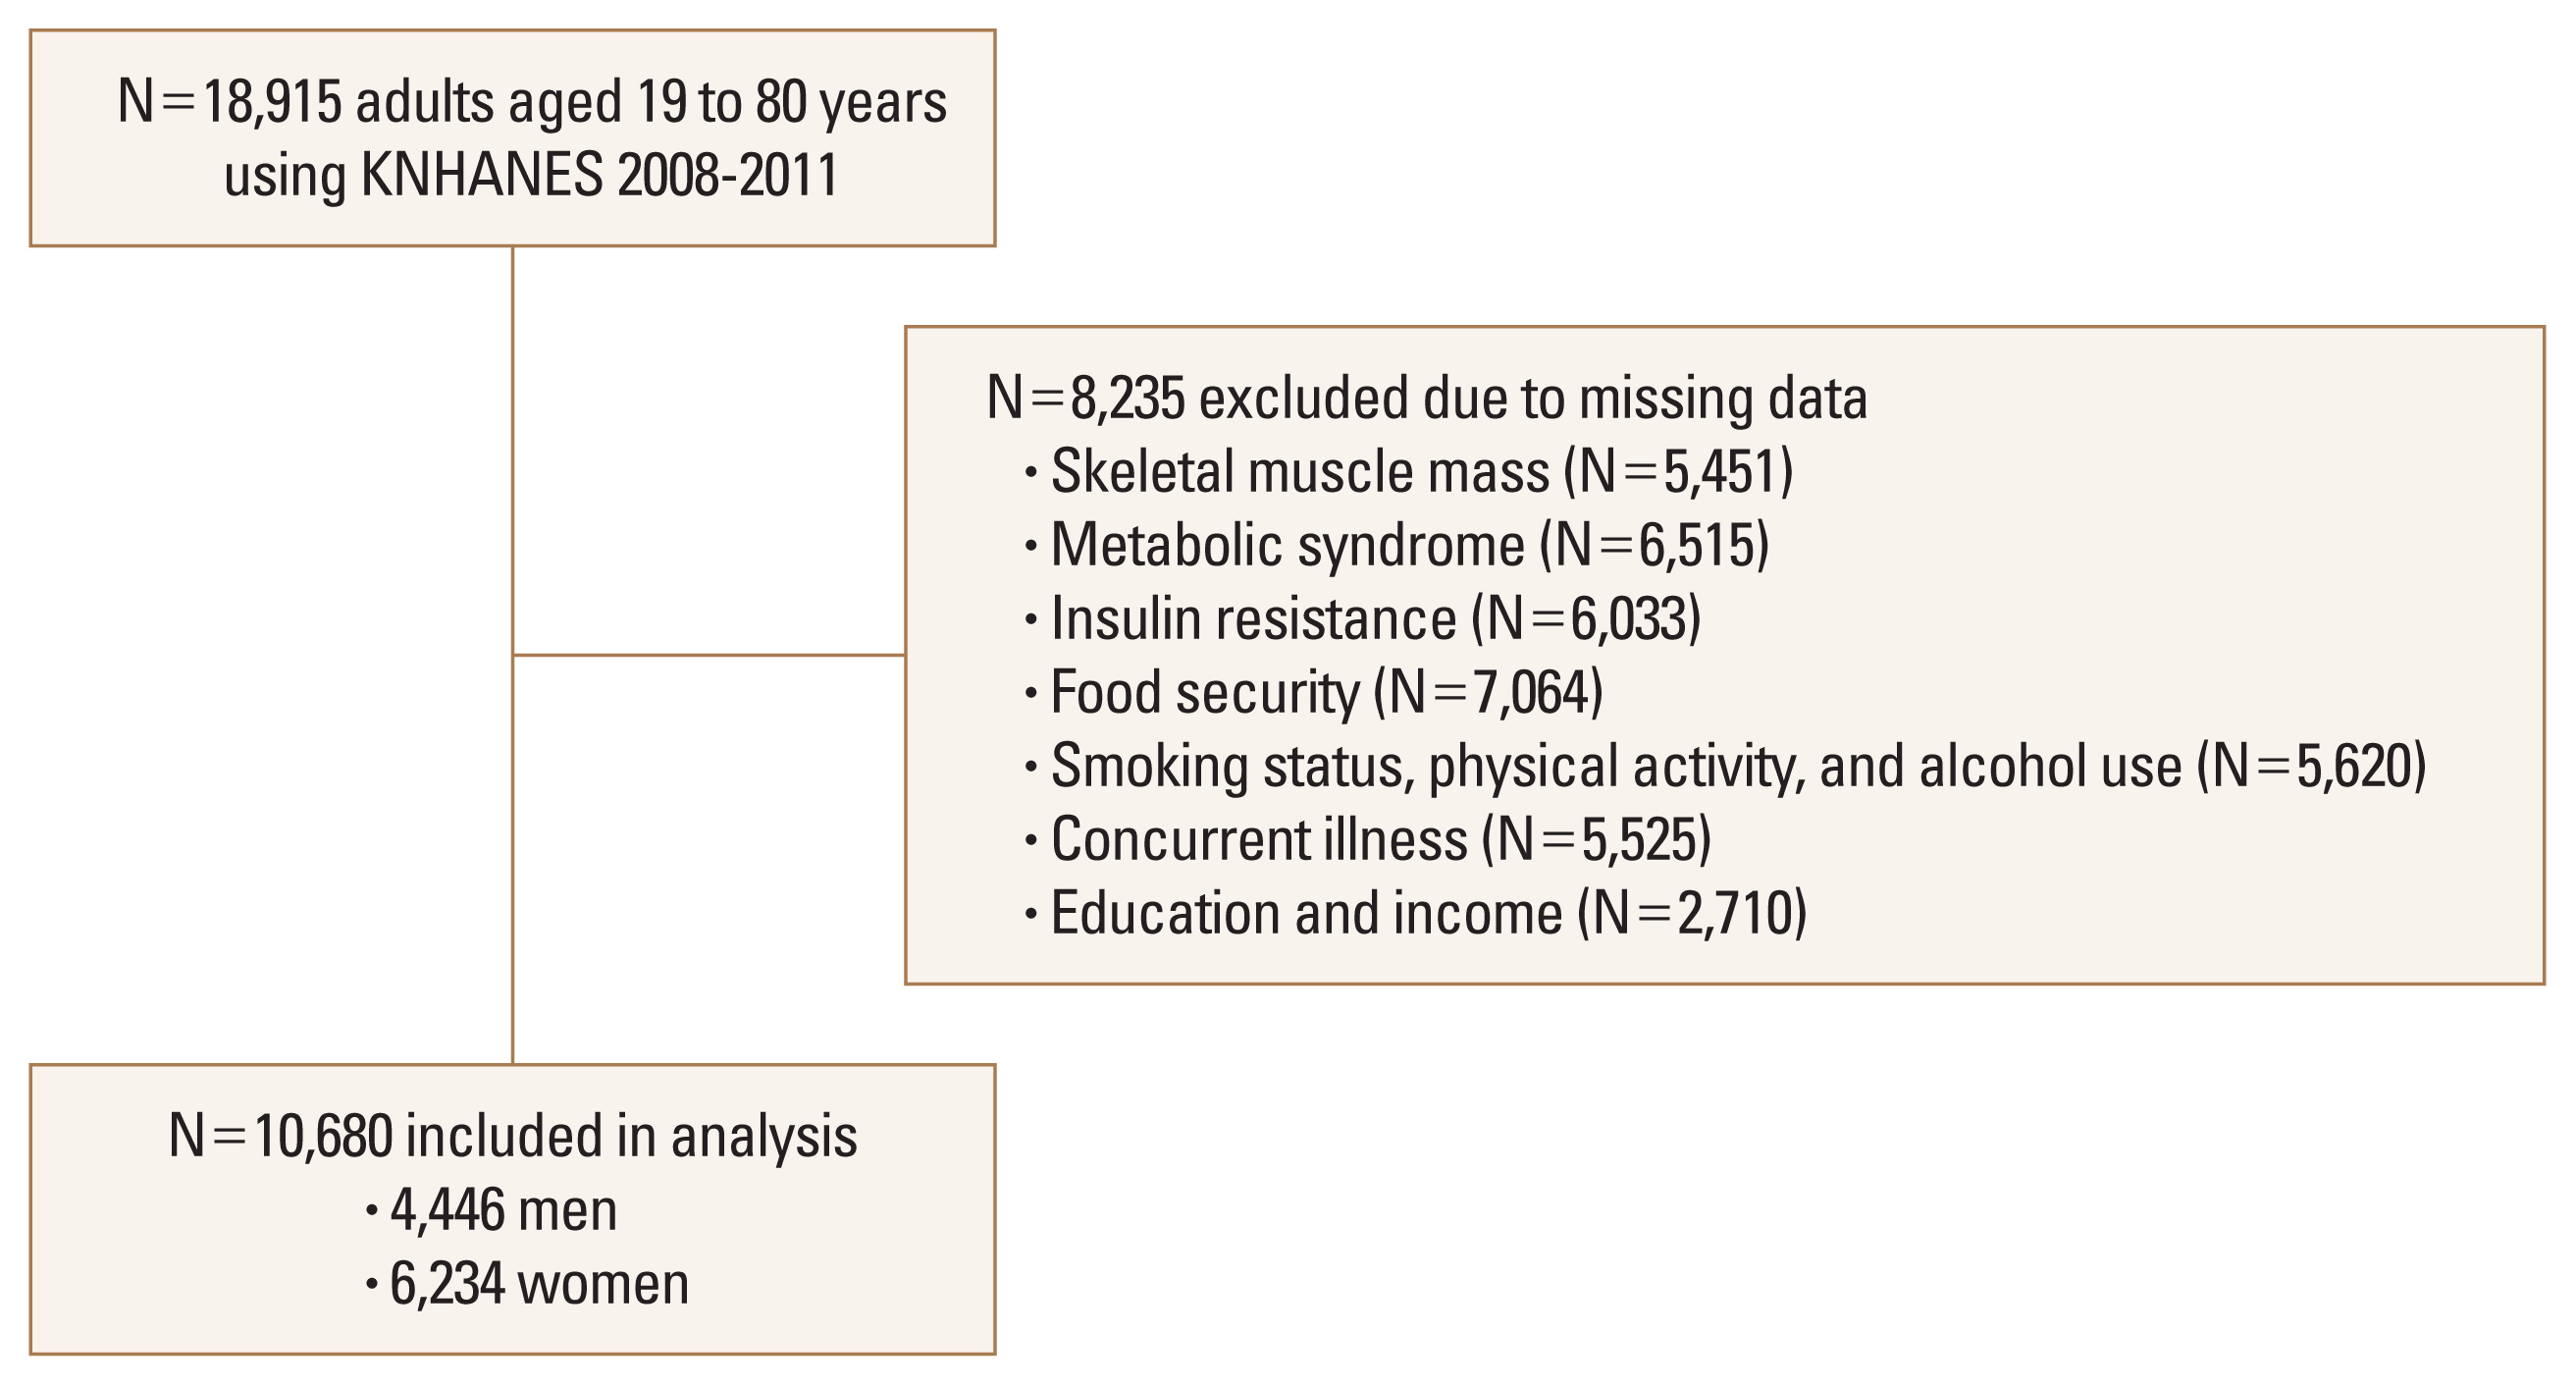
The subjects of this study were a representative sample of the civilian, noninstitutionalized Korean population included in the Korea National Health and Nutrition Examination Survey (KNHANES) that was conducted during 2008 to 2011. The survey used a multistage, stratified, systematic sampling method and a rolling survey sampling of household units.[21,22] The current study included 10,680 subjects (4,446 men and 6,234 women) aged between 19 and 80 years who provided complete data on skeletal muscle mass, MetS, IR, food security, health behaviors, concurrent illness, and demographic characteristics (Fig. 1). Informed consent was obtained from all subjects. Written informed consents were obtained from all subjects. The study protocol was approved by the Institutional Review Board (IRB) of Korea Centers for Disease Control and Prevention (IRB no. 2008-04EXP-01-C, 2009-01CON-03-2C, 2010-02CON-21-C, and 2011-02CON-06-C).[23]
2. Muscle mass, MetS, and IR
Skeletal muscle mass was defined as appendicular skeletal muscle mass (ASM) divided by body mass index (BMI) [12] ASM was assessed using dual energy X-ray absorptiometry (Discovery QDR4500W; Hologic Inc., Bedford, MA, USA). BMI was calculated by measured weight divided by measured height (kg/m2). Sarcopenia was defined as an ASM/BMI <0.789 for men and <0.512 for women, based on the Foundation for the National Institutes of Health Sarcopenia Project.[24] Other skeletal muscle mass indicators were calculate as the ASM divided by squared height (ASM/ height2) [25] or weight (ASM/weight) [26] for sensitivity analysis.
Waist circumference (WC) was measured to the nearest 0.1 cm at the end of normal expiration at the midpoint between the lowest rib and the iliac crest. Blood pressure (BP) was measured 3 times using a standard manual sphygmomanometer with the participants seated and the average of the second and third BP values was used. Antecubital venous blood samples were taken from each subject after a 12 hr overnight fast. An automatic analyzer (Automatic Chemistry Analyzer 7600; Hitachi Ltd., Tokyo, Japan) was used to measure insulin levels using an immunoradiometric assay, while high-density lipoprotein (HDL) cholesterol and triglyceride (TG) levels were measured using an enzyme method, and glucose levels were measured by enzymatic colorimetric method. MetS was defined as satisfying at least 3 of the following components. The MetS components were WC ≥90 cm (for men) or 85 cm (for women) [27]; BP ≥130/85 mmHg or a history of hypertension; fasting plasma glucose levels ≥5.6 mmol/L (100 mg/dL) or a history of diabetes mellitus; HDL levels <1.03 mmol/L (40 mg/dL) for men or 1.29 mmol/L (50 mg/dL) for women; and TG levels ≥1.7 mmol/L (150 mg/dL).[28] An individual was defined as having a history of hypertension or diabetes mellitus based on having been diagnosed by a physician or currently being treated for those illnesses using a standardized questionnaire.[29]
3. Food security
Food security was assessed with a single-item questionnaire that was verified for reliability and validity.[32] The tool was used in the National Health and Nutrition Examination Survey (NHANES) III in the USA as a food sufficiency questionnaire [7,33] and composed as follows. “Which of the following has best represented your family’s dietary situation in the last year?” and the 4 answers: “We were able to eat as much as we wanted and in a wide variety of foods”, “We were able to eat enough food, but we were not eating a variety of foods”, “We were economically difficult, so we sometimes did not have enough food”, and “We were economically difficult, so we often lacked food”.[23,34] In this study, 4 levels of food security were determined: food security for the first answer, marginal food security for the second answer, low food security for the third answer, and very low food security for the fourth answer. One person in the household responded on behalf of the food security for the last year.
4. Confounding factors
The potential confounding variables were evaluated using the data of the survey. These variables included education level (≤graduated high school or >graduated high school), household income level (<3rd quartile or ≥3rd quartile), current smoking status (yes or no), alcohol use (yes or no for drinking at least once a month for the past year), physical activity (yes vs. no for engaging in high-intensity activity for >75 min/week or moderate-intensity activity for >150 min/week), and chronic diseases (number of diseases diagnosed as diabetes, hypertension, dyslipidemia, cardiovascular diseases, pulmonary tuberculosis, asthma, arthritis, depression, liver cirrhosis, kidney failure, and cancers), and daily intake of fat and protein.
5. Statistical analyses
All analyses were weighted to account for the multistage, clustered probability sampling for the KNHANES. Complex samples χ2 test or complex samples generalized linear model was applied to compare categorical variables or continuous variables among food security levels. After adjusting for the confounding factors including age, gender, educational background, economic level, smoking, drinking, physical activity, chronic diseases, and daily intake of fat and protein, complex samples logistic regression analysis was performed to analyze the relationships of ASM/BMI, food security, and the interaction between ASM/BMI and food security with MetS, individual MetS components, and IR. The sensitivity analysis was undertaken on the relationship between other skeletal muscle mass indicators and MetS and IR after adjusting for the same confounding variables. Considering the difference in the skeletal muscle mass by gender, the same analysis was performed on the association between ASM/BMI and MetS and IR in each gender after adjusting for the same confounding factors excluding gender. Then, the relationships of ASM/BMI with MetS, individual MetS components, and IR for each food security level were additionally analyzed using complex samples logistic regression analysis. Similarly, by applying complex samples general linear model, analyses were performed with the MetS indicators as continuous variables and HOMA-IR as outcome variables.
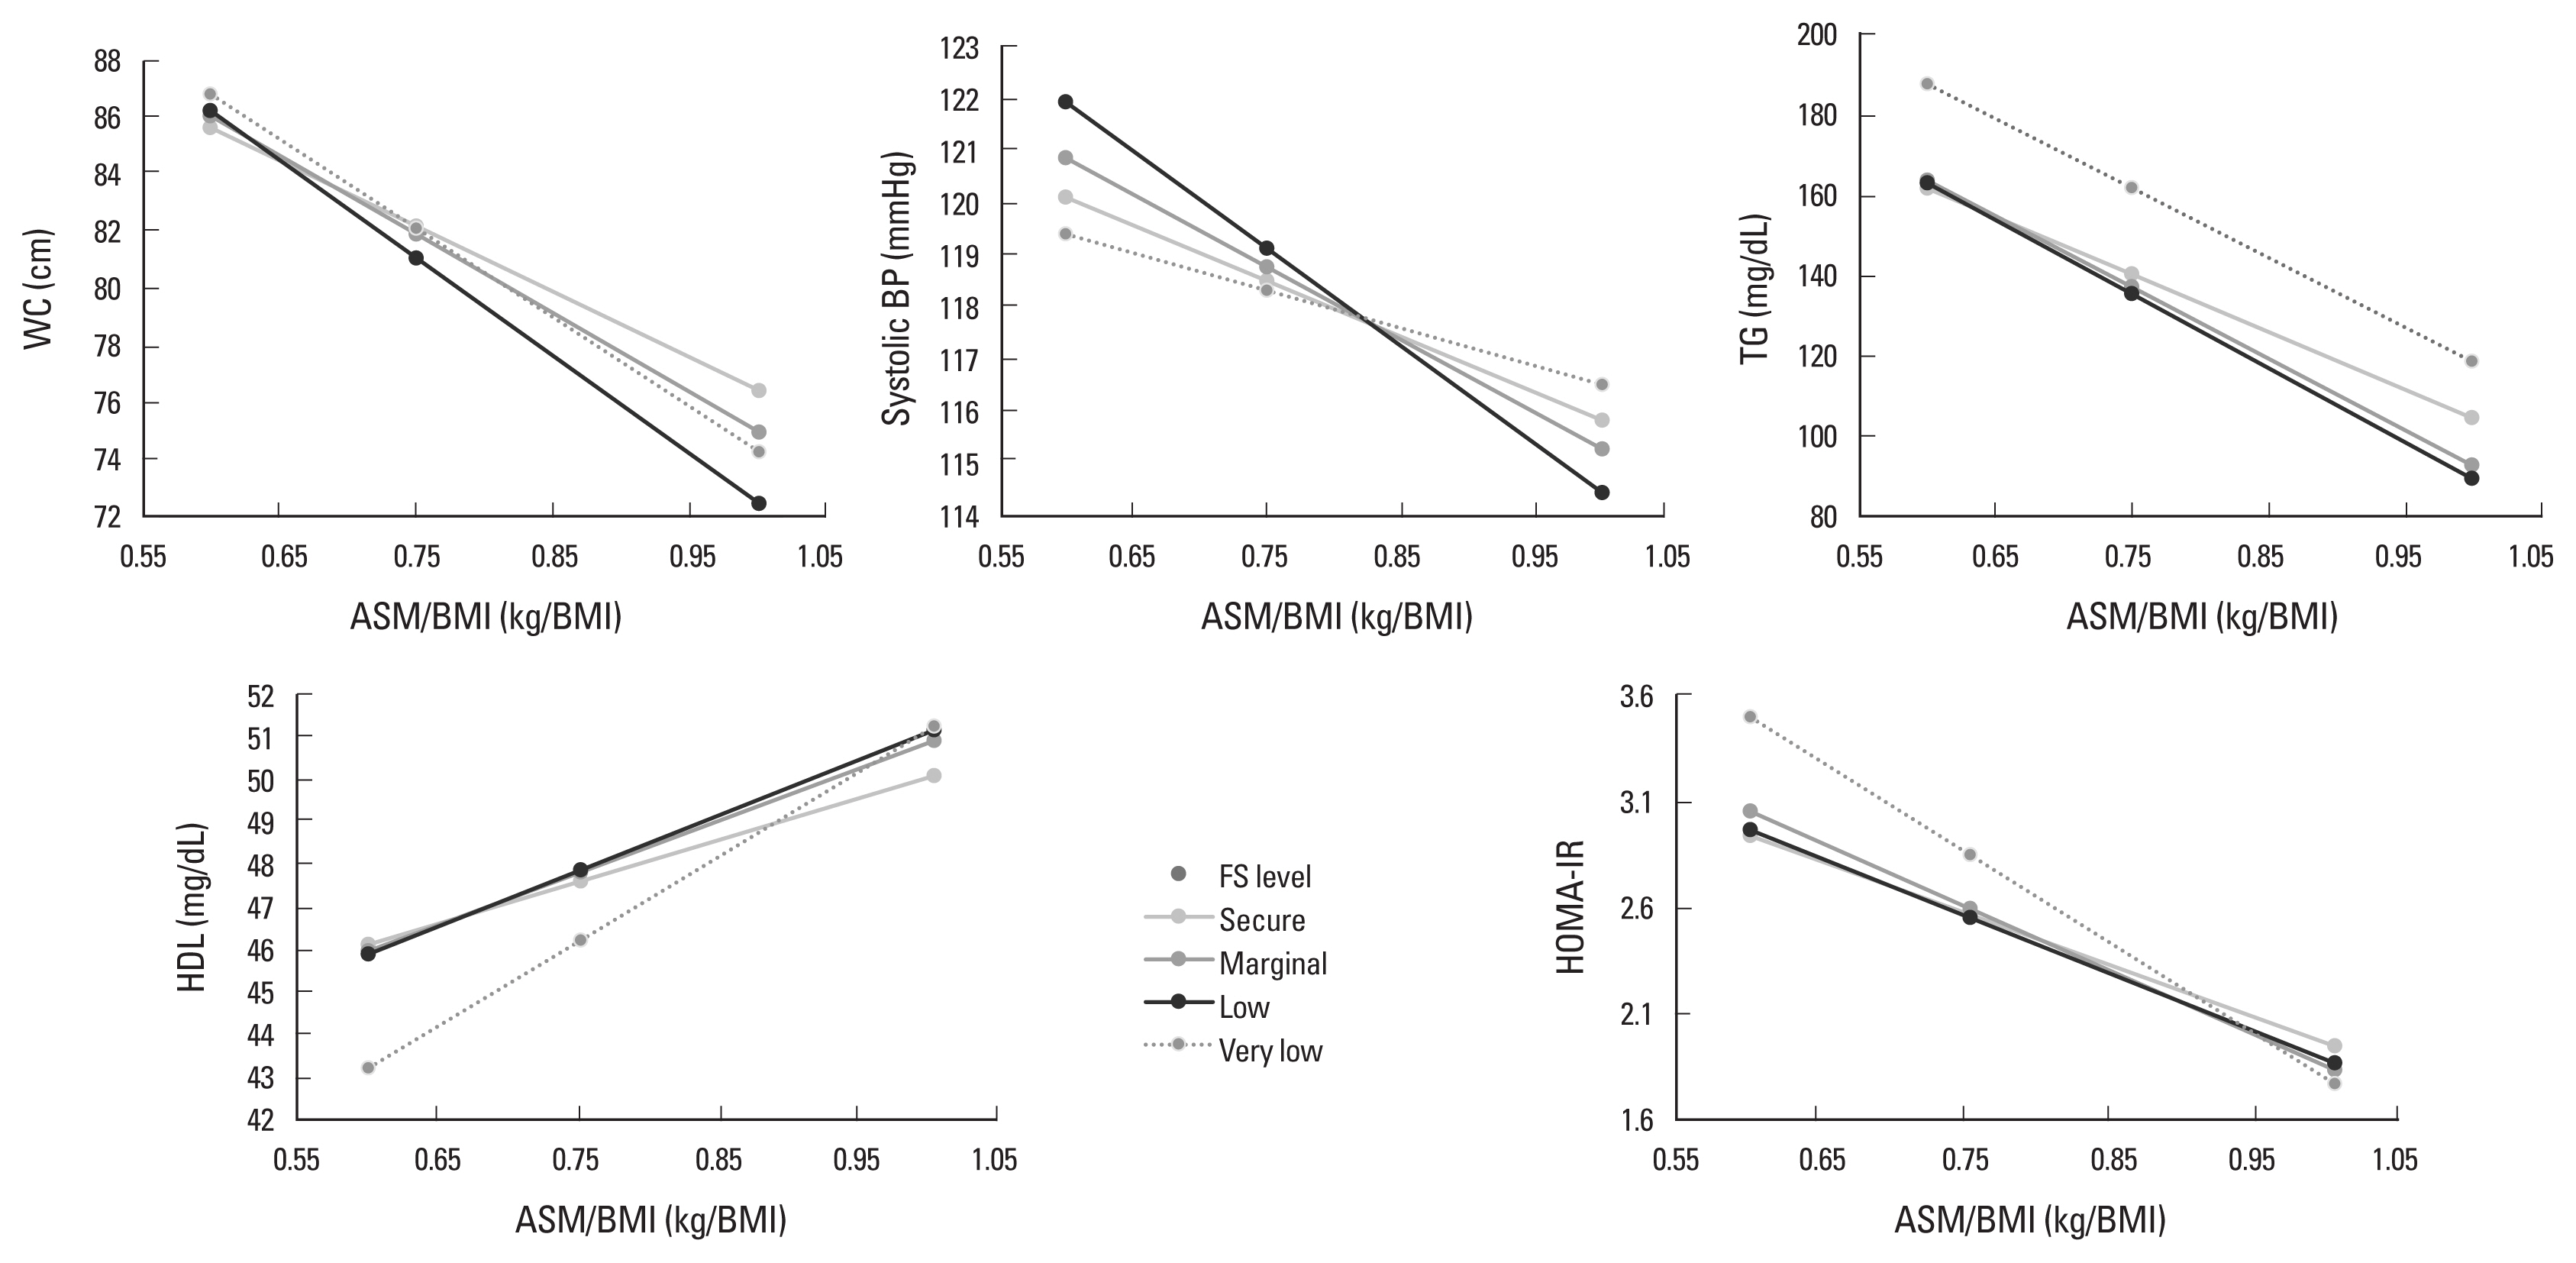
Moderation of food security in the relationships of ASM/BMI with MetS components (as continuous variables) and HOMA-IR was evaluated with the PROCESS macro of SPSS version 26.0, developed by Hayes.[35] The conditional effects of ASM/BMI on the MetS components and HOMA-IR for each food security level after adjusting for the confounding variables were visualized as Figure 2. All analyses were performed using the IBM SPSS software version 27.0 (IBM Corp., Armonk, NY, USA).
RESULTS
In this representative Korean adults, 4.2% had households with low or very low food security, and 26.0% and 24.3% had MetS and IR, respectively. Subjects from households with lower food security had lower skeletal muscle mass indicators, higher prevalence of sarcopenia, MetS, and high HOMA-IR, older age, lower educational background, lower economic level, lower daily intake of fat and protein, and chronic diseases than those from households with higher food security (Table 1).
Table 2 shows the associations of ASM/BMI, household food security, and the interaction between food security and ASM/BMI with MetS and IR after adjusting for the confounding variables. When the ASM/BMI increased by 0.1 kg/BMI, the odds for MetS and IR decreased by 36% and 29%, respectively. There was a significant interaction between ASM/BMI and food security in the relationship with MetS. In the analysis by food security level, the lower the food security level, the higher the inverse relationship between ASM/BMI and MetS. An increase in ASM/BMI of 0.1 kg/BMI resulted in a 17% to 41% reduction in odds for all components of the MetS, and the interactions between ASM/BMI and food security in these relationships were significant. On the other hand, a 1-level decrease in food security was associated with a 2.17-fold increase in odds for MetS (Table 2).
After adjusting for the confounding variables, household food security, and interaction between ASM/BMI and food security, an increase of ASM/BMI was associated with a decrease in WC, BP, glucose, TG, and HOMA-IR, and an increase in HDL. There were significant interactions between ASM/BMI and food security in these associations except for glucose and HOMA-IR. The MetS component change according to the increase in ASM/BMI was greater when food security was less secure (Table 3). Figure 2 presents the relationships of ASM/BMI with WC, systolic BP, TG, HDL, and HOMA-IR according to food security level. The inverse relationships of ASM/BMI with WC, TG, and HOMA-IR and the positive relationship between ASM/BMI and HDL were likely to increase as food security decreased.
Table 4 presents the results of a sensitivity analysis using other skeletal muscle mass indicators, as well as gender-specific analysis findings. A one-unit increase in ASM/height2 and ASM/weight was linked with a 2.02 to 2.66 times increase and a 20% to 33% decrease in the odds ratio (OR) for MetS and IR, respectively, in the adjusted models. As a result of analysis according to gender, the OR of MetS and IR decreased by 34% to 36% in men and 34% to 39% in women according to the increase in ASM/BMI. At a very low food security level, this OR decreased by 58% to 88% in men but was not significant in women. In this gender-specific analysis, there was no significant interaction between ASM/BMI and food security.
DISCUSSION
This study suggested that the inverse relationships of skeletal muscle mass with MetS and IR could be greater when food security was less secure in a representative Korean population. When ASM/BMI increased by 0.1 kg/BMI, the odds of MetS and IR decreased by 32% and 36% in the food security group, respectively, but decreased by 46% and 54% in the very low food security group, respectively. There was a tendency for the relationships of ASM/BMI with individual factors of MetS to be greater in subjects from households with less food security than households with food security. These results were similar even when the components of MetS and IR were considered as continuous variables. This result, in which the decrease in OR for MetS and IR with increasing skeletal muscle mass was greater in subjects from households with less food security, was more evident in men and was also shown in the results analyzed using ASM/weight as a skeletal muscle mass indicator.
There may be a lack of studies that investigated the relationship between skeletal muscle mass and MetS and IR according to the level of household food security. On the other hand, there are studies that suggested the associations of food security with sarcopenia,[13] grip strength,[14] MetS,[16] and IR.[19] Using the cross-sectional data from the Study on Global Ageing and Adult Health, severe food insecurity was linked to 2.05 times higher risk of sarcopenia in older adults in low- and middle-income countries.[13] In a cross-sectional study using the NHANES, the odds for weak grip strength in USA older adults in households with food insecurity was about twice higher than those who were food secure.[14] In another study using data of the NHANES, compared with adults who were food secure, adults in households with marginal and very low food security had 1.8-fold and 1.65-fold increased odds of MetS, respectively.[16] In another study using this data, there was an association between lower food security and IR according to weight status in men, whereas there was no such association in women.[19]
Although these studies suggest that low food security may be associated with low skeletal muscle mass and a higher risk of MetS and IR, the mechanisms by which the association between skeletal muscle mass and MetS and IR increases when food security levels are low are unclear. Low food security can lead to a lack of protein consumption, which is necessary for muscle mass preservation, as well as a shortage of various nutrients necessary for muscle metabolism.[36,37] In addition, low food security in the household may lead to an increase in the consumption of high-energy-density but nutritionally imbalanced foods, which can contribute to abdominal obesity, hypertension, hyperglycemia, and dyslipidemia.[16] If food security is low, eating patterns of episodic under consumption and overconsumption according to food availability and stress-related hormonal and autonomic dysregulation may occur, which may increase the risk of IR.[19] As a result, if food security is inadequate, the risk of low skeletal muscle mass and MetS and IR are likely to be higher, and the link between skeletal muscle mass and MetS and IR may be increased. Food security, based on these findings, may alleviate the interrelationship between low skeletal muscle mass, MetS, and IR. At low levels of food security, the Carbohydrate-Insulin Model of obesity may be involved.[38] Because fat and protein intake tended to be lower at lower levels of food security, the proportion of carbohydrate intake will increase with lower levels of food security compared to a secure level of food security. Excessive carbohydrate consumption causes postprandial hyperinsulinemia, which leads to adipose tissue storage.[38] Excess body fat can lead to malfunction as a result of factors like aging, and it can also have a negative impact on muscles.[39]
The results of ASM/weight and ASM/BMI remained similar in sensitivity analysis, while ASM/height provided the opposite results. The discrepancies could be explained by the different body-size adjustment methods for estimating skeletal muscle mass. If ASM is divided by BMI or weight rather than height, it is more likely to adjust fat mass.
Previous research has also suggested that ASM/height has an unfavorable relationship with cardiometabolic risk factors.[40,41] The mechanisms underlying the gender-differences in the associations of ASM/BMI with MetS and IR at low and very low levels of food security are unclear. Men may be more prone than women to have impaired muscle metabolic functions, such as glycemic regulation homeostasis and insulin sensitivity,[42] at low or very low food security levels.
At low food security, the MetS and high WC and high BP among the MetS components exhibited a less noticeable tendency to lower the OR as ASM/BMI increased. Although the mechanism for these findings is uncertain, these findings suggest that the relationships of ASM/BMI with MetS, as well as high WC and high BP are not markedly different from secure to low food security levels, but that there is a possibility of strengthening of the association at very low food security levels.
Although the results of this study may be generalized to Koreans in terms of utilizing the survey data of representative population groups of Koreans, the following limitations should be taken into account. These limitations include the difficulty in inferring causality due to the cross-sectional study design and the residual confounding factors that were not adjusted in the analysis. Despite these limitations, the significance of this study is that it reaffirmed the importance of food security for health as it suggested the possibility that food security could be a factor moderating the relationships of skeletal muscle mass with MetS and IR. A prospective intervention study will be needed to determine whether these results are changed through the improvement of food security.
In conclusion, this study based on data for the KNHANES demonstrated households with lower food security might be more vulnerable to the inverse associations of skeletal muscle mass with MetS and IR. Food security will need to be improved to mitigate the vulnerability of these groups.
 PDF Links
 PubReader
 ePub Link
 Full text via DOI
 Full text via PMC
 Download Citation
 Print
Print