Homogenic Evaluation for Spatial Distribution in Osteoclast Differentiation
Article information

Abstract
Background
Cells have heterogeneous cellular diversity in size, morphology, cell cycle, metabolism, differentiation degree, and spatial distribution. The shift of specific cells towards the desired cells is crucial for maintaining uniform cellular function and can be represented by homogeneity and heterogeneity. Here, we developed a simple and direct method for evaluating the homogeneous distribution of desired cells in a constant region.
Methods
We differentiated osteoclast progenitors into bone-resorbing multinucleated giant osteoclasts in a 2-dimensional culture plate under 2 conditions. Cells were stained with tartrate-resistant acid phosphatase to assess osteoclast differentiation, images were taken using a microscope and divided into sectors, and the number of osteoclasts (≥3 nuclei) in each sector was counted. To assess the homogeneity of the spatial distribution of osteoclasts, the standard deviation (SD) was calculated from the mean number of osteoclasts within each sector.
Results
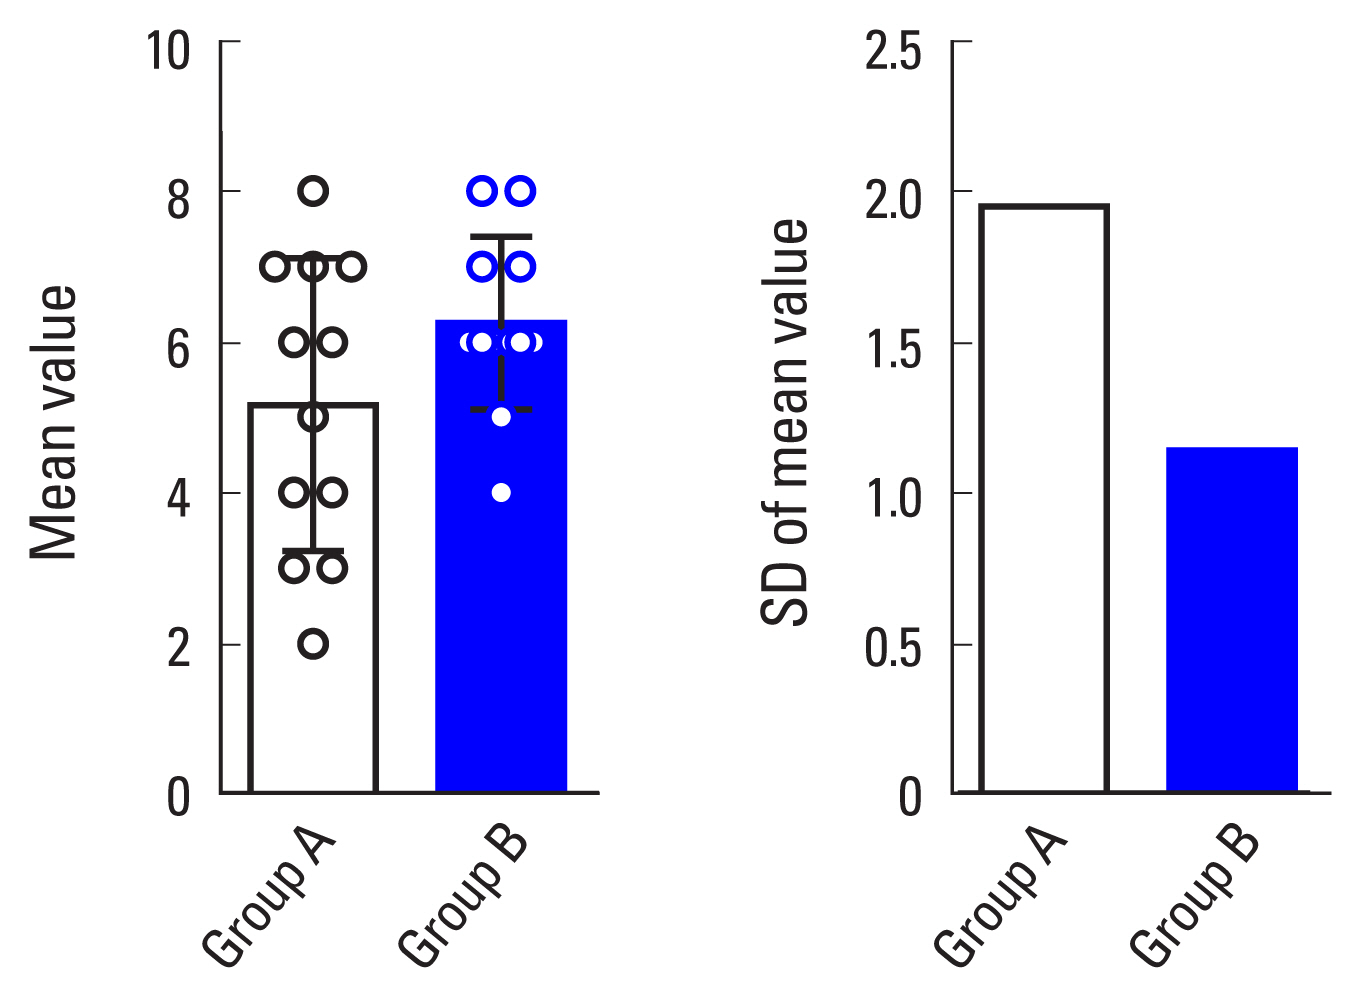
From the 2 groups, a value with a SD close to 0 indicates high spatial homogeneity while a relatively high SD represents low spatial homogeneity.
Conclusions
Our findings suggest that spatial homogeneity can be represented as SD.
INTRODUCTION
Cells are necessary for switching between homogeneous and heterogeneous states according to circumstances. Unidirectional differentiation and proliferation of stem cells into a homogeneous cell population are effective in maintaining uniform cellular function.[1] A high yield of cells of interest by reducing heterogeneous cell populations is also important for improving cell therapy to treat diseases.[1,2] Conversely, the drift of homogeneous cells to heterogeneous cells confers specialized functions in physiological and pathological conditions. Heterogeneous cells derived from homogeneous cells are favorable for coping with changing environments [3]; on the contrary, cancer cell heterogeneity caused by genetic mis-regulations (e.g., genomic instability, epigenetic alteration, and plastic gene expression), signal transduction, and microenvironmental differences drives phenotypic diversity (heterogeneity), resulting in resistance to anticancer treatment).[4] Hereafter, the biotechnology-based development of heterogeneous cancer cells with resistance to anticancer treatment that can induce homogeneous cancer cells with sensitivity to anticancer drugs becomes an important issue.[5,6] Thus, a proper balance between heterogeneous and homogeneous cells is required to regulate cell capacity in various environments under time and space of physiological conditions.
In in vitro cell culture, cells show differences between neighboring cells in the same area and space. Their cells display differences in external cellular phenotypes (e.g., cell size and morphology) and internal cellular events that happen inside the cell (e.g., cell cycle, metabolic and cellular signaling pathways, and transcriptional and translational activities).[7] In addition, the final cells formed under specific conditions differ in their degree of differentiation and spatial distribution.[8] This difference could result from various factors, such as medium composition, cell dispersion and confluence, and heterogeneous cell populations with genetic background variation. Reprograming heterogeneous cells to homogeneous cells will act favorably in inducing cells with a uniform function. For instance, mesenchymal stem cells with ectopic expression of specific transcription factors promote trans-differentiation into osteogenic, chondrogenic, adipogenic and myogenic cell lineage [9] or synchronized osteoclast progenitors with cell cycle arrest by macrophage colony-stimulating factor (M-CSF) depletion effectively undergo uniform osteoclast differentiation.[10] Among the cellular heterogenic diversities in microenvironments that vary in time and space, the spatial distribution of cells serves as a cell fate determinant of migration, differentiation, proliferation, and programmed cell death.[11–14] This is also a key player in tissue development.[15]
Parallel to the technical exploration of switching between heterogeneous and homogeneous cells, a method for evaluating homogeneity is required to accurately define the degree of homogeneity. In this study, we developed a simple method for assessing the extent of the spatial distribution of a certain cell in a constant area. The mean value of the desired cell number in a region was obtained from all cell numbers within the total area, and the standard deviation (SD) was then calculated from the deviated value of the mean. Small and large SDs represent high and low homogeneities, respectively. This method is useful for assessing the spatial distribution of the targeted cells in 2-dimensional (D) area and 3D space.
METHODS
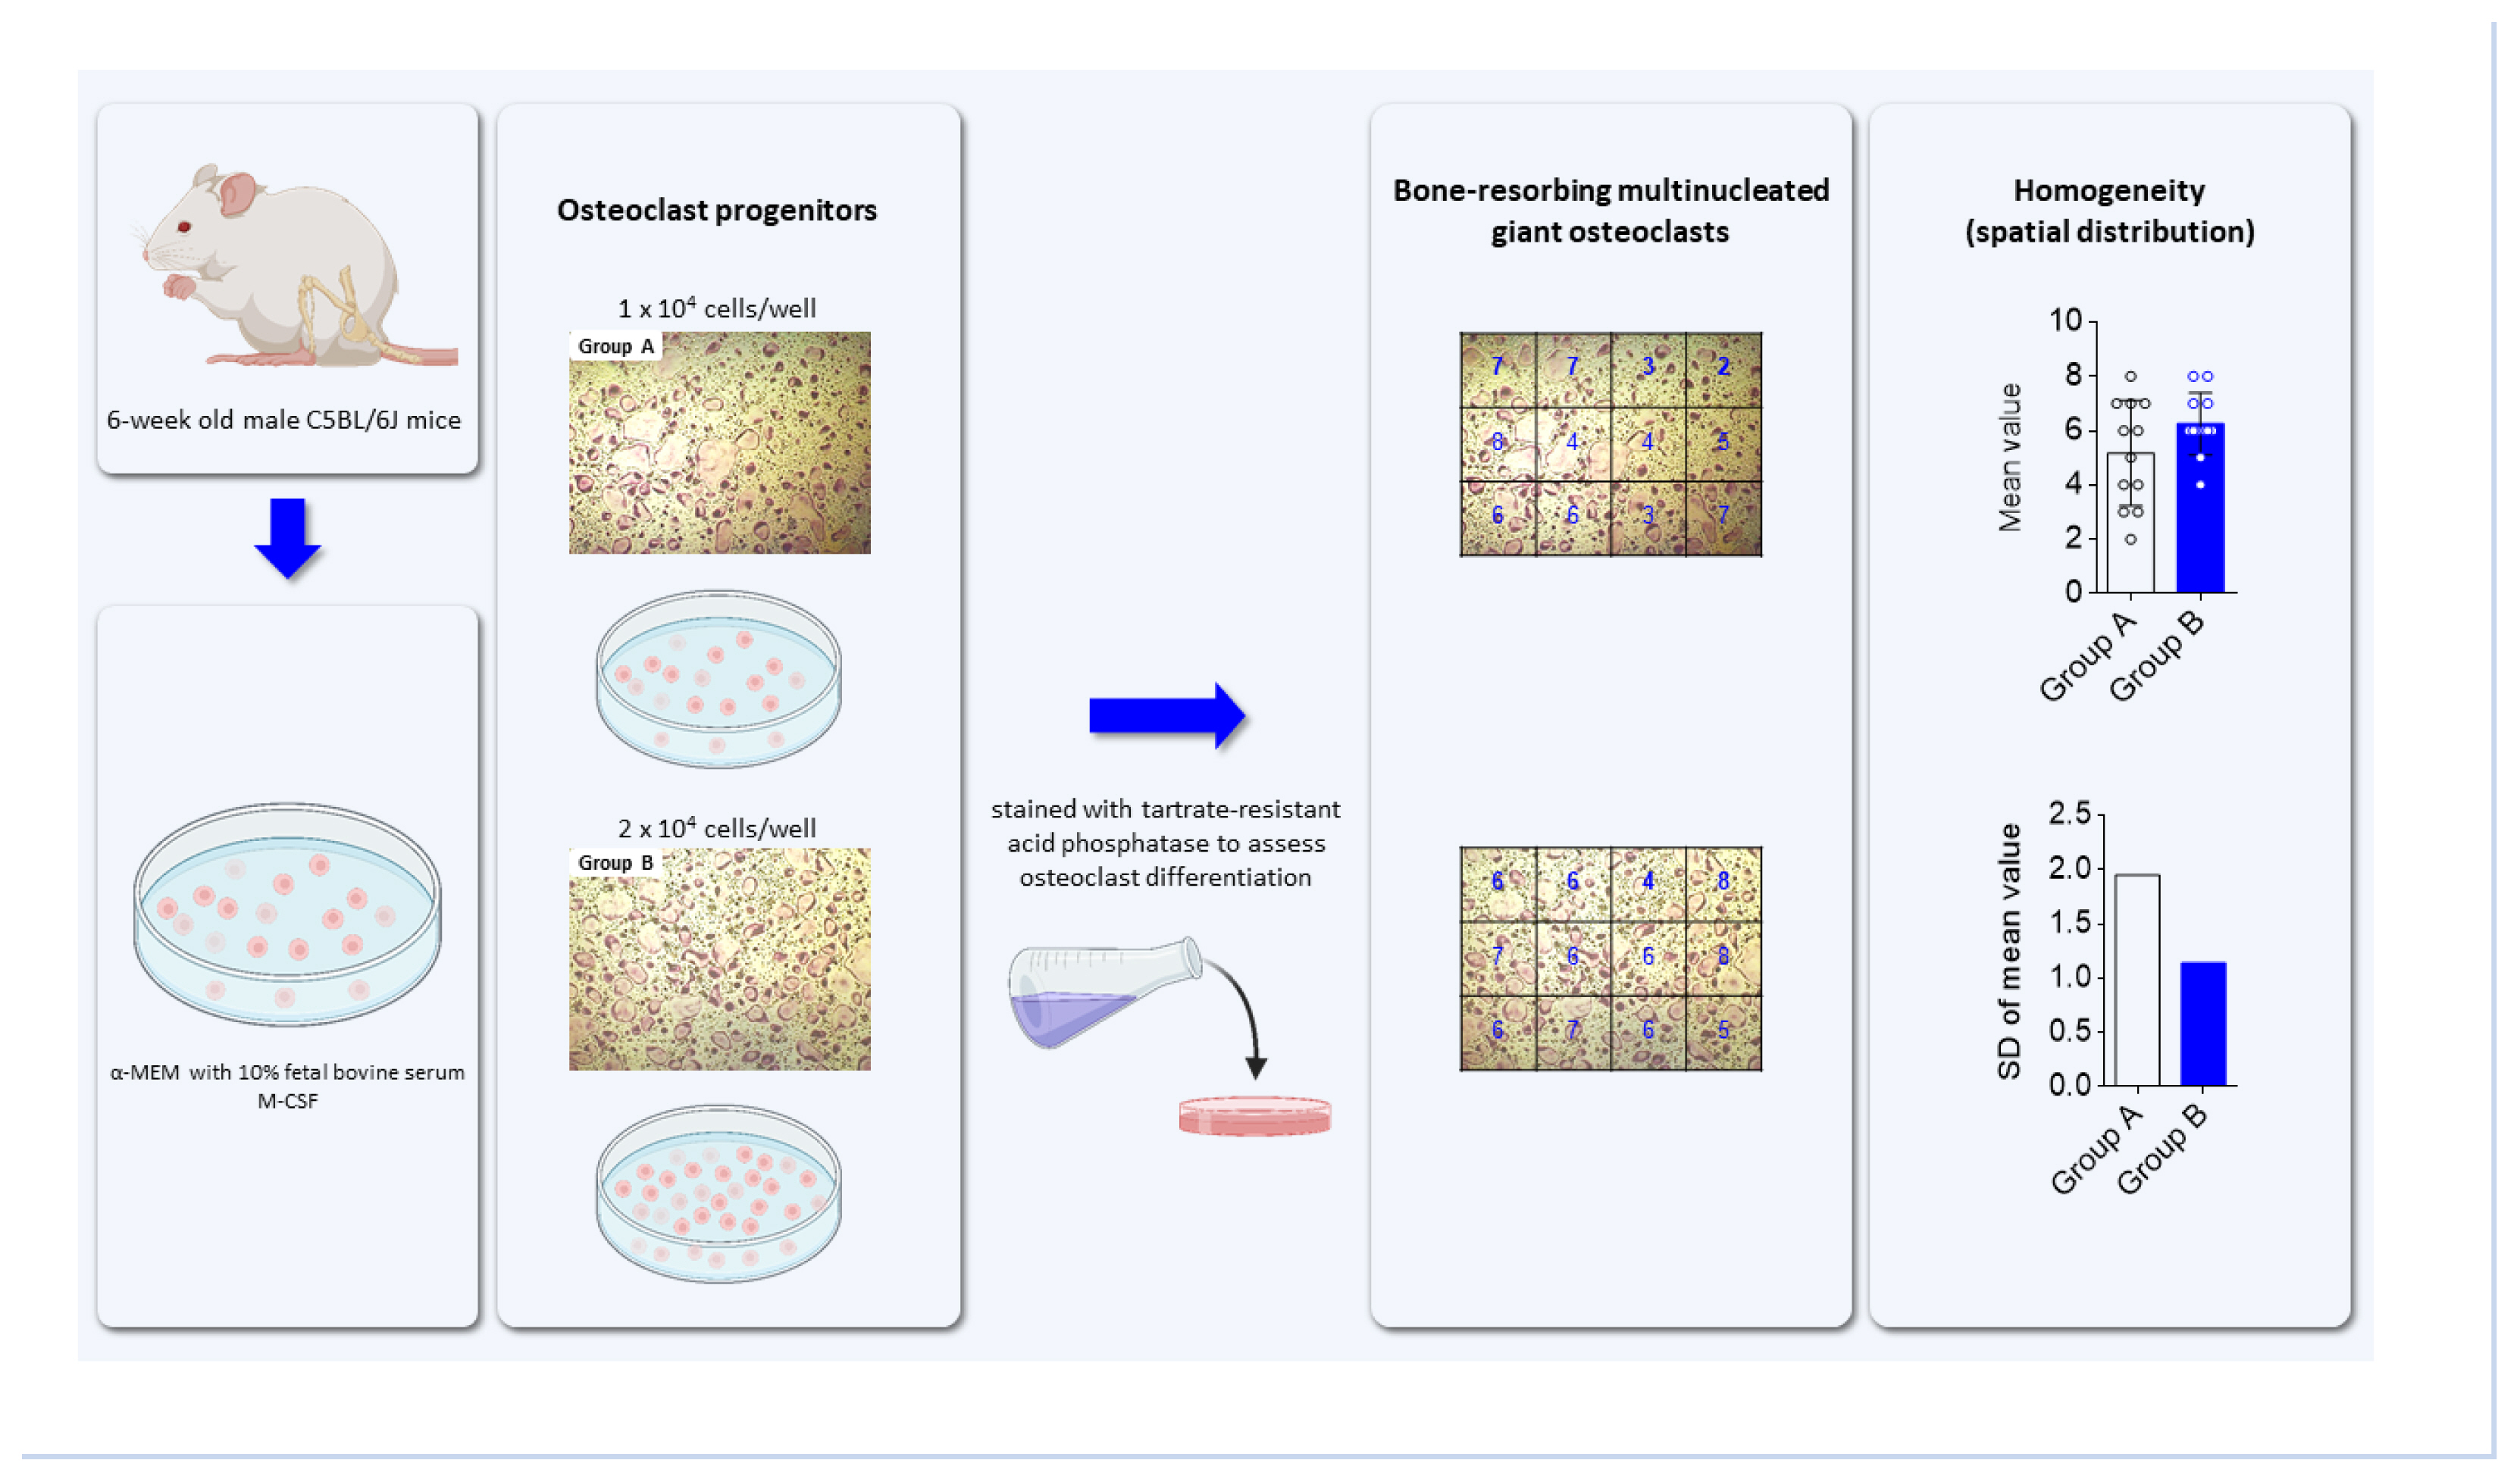
To generate osteoclast progenitors, bone marrow cells were flushed out from the femur and tibia of 6-week-old male C5BL/6J mice (Central Lab Animal, Seoul, Korea) using α-minimal essential medium (α-MEM; HyClone, Logan, UT, USA). Cells were plated on cell culture plates in α-MEM with 10% fetal bovine serum (FBS) and 5 ng/mL M-CSF, and incubated in a humidified incubator with 5% CO2 at 37°C overnight. Non-adherent cells were harvested and cultured in α-MEM containing 10% FBS and 30 ng/mL M-CSF for 2 days to produce osteoclast progenitors. For osteoclast differentiation, osteoclast progenitors (1×10⁴ cells/well or 2×10⁴ cells/well in a 24-well culture plate) were cultured in α-MEM with M-CSF (30 ng/mL) and receptor activator of nuclear factor-κB ligand (RANKL; 100 ng/mL) for 4 days, with fresh medium replaced after 2 days. To assess osteoclast formation, cells were washed with phosphate-buffered saline, fixed with 3.7% (v/v) formaldehyde, and stained for tartrate-resistant acid phosphatase (TRAP) using a commercial leukocyte acid phosphatase staining kit (Sigma-Aldrich, St. Louis, MO, USA). After cell images were taken under a light microscope, TRAP-positive multinucleated cells (TRAP+MNCs) with more than 3 nuclei were counted to assess the extent of osteoclast differentiation in a constant area.
RESULTS AND DISCUSSION
1. Three formulas for assessing cellular homogeneity in spatial distribution
To assess the spatial distribution, the images taken under different cell conditions were divided into sectors with a regular quadrangle. After counting specific cells within each sector and adding all cell numbers, the mean, a statistical average, was calculated by dividing the sum of all the numbers within the sector by the number of sectors, as described in equation (1).
Where m is the average value (mean) for all cell numbers of each sector, n is the sector number, and Si is the cell number in each sector.
Next, to characterize the scatter around the mean value, the variance (V) of a sector n, defined in equation (2), was calculated.
Finally, the SD (σ), which is a measure of the amount of variation or dispersion of a set of values, was calculated from the square root of the variance [as described in equation (3)].[16]
A low SD indicates that the values are clustered closely around the mean, whereas a high SD indicates that they are scattered far from the mean. Thus, the SD deduced from the resulting mean can be applied to evaluate the spatial distribution of the targeted cells in a constant region.
2. Application of SD to homogenic assessment for the spatial distribution of osteoclast differentiation
To demonstrate the possibility that SD can be applied to assess the spatial homogeneity of a certain cell, we attempted to induce the differentiation of bone marrow-derived osteoclast progenitors into bone-resorbing multinucleated osteoclasts. As shown in Figure 1, osteoclast progenitors with cell numbers of 1×10⁴ cells/well (group A) and 2×10⁴ cells/well (group B) in 24-well plates were cultured in a medium containing M-CSF. When the cells reached approximately 40% (group A) and 60% confluence (group B), they were differentiated into osteoclasts in a conditioned medium containing M-CSF and RANKL for 4 days. To assess the homogeneous distribution of differentiated osteoclasts, cell images were taken from the 2 groups (A and B) under a microscope. After the images were divided into regular quadrangle sections, osteoclasts with more than 3 nuclei within each sector were counted. The mean was obtained by dividing the sum of the cell numbers for all sectors by the number of sectors, and the SD was estimated from the resulting mean. SD provides the extent of homogeneous distribution between groups, whether the values converge to and diverge from the mean. The SDs for groups A and B were 1.946 and 1.138, respectively, indicating that the osteoclasts in group B, which had a lower SD, were more evenly distributed in the 2D culture condition than those in group A, which had a higher SD. Moreover, the graphs of the mean and SD can be used to visualize the extent of homogeneous distribution (Fig. 2). The higher homogeneity in the distribution of osteoclasts in group B compared to those in group A could be attributed to the fine-tuned communication between adjacent mononuclear osteoclast progenitors and the effective sequential processes via increased mononuclear cell migration and fusion.
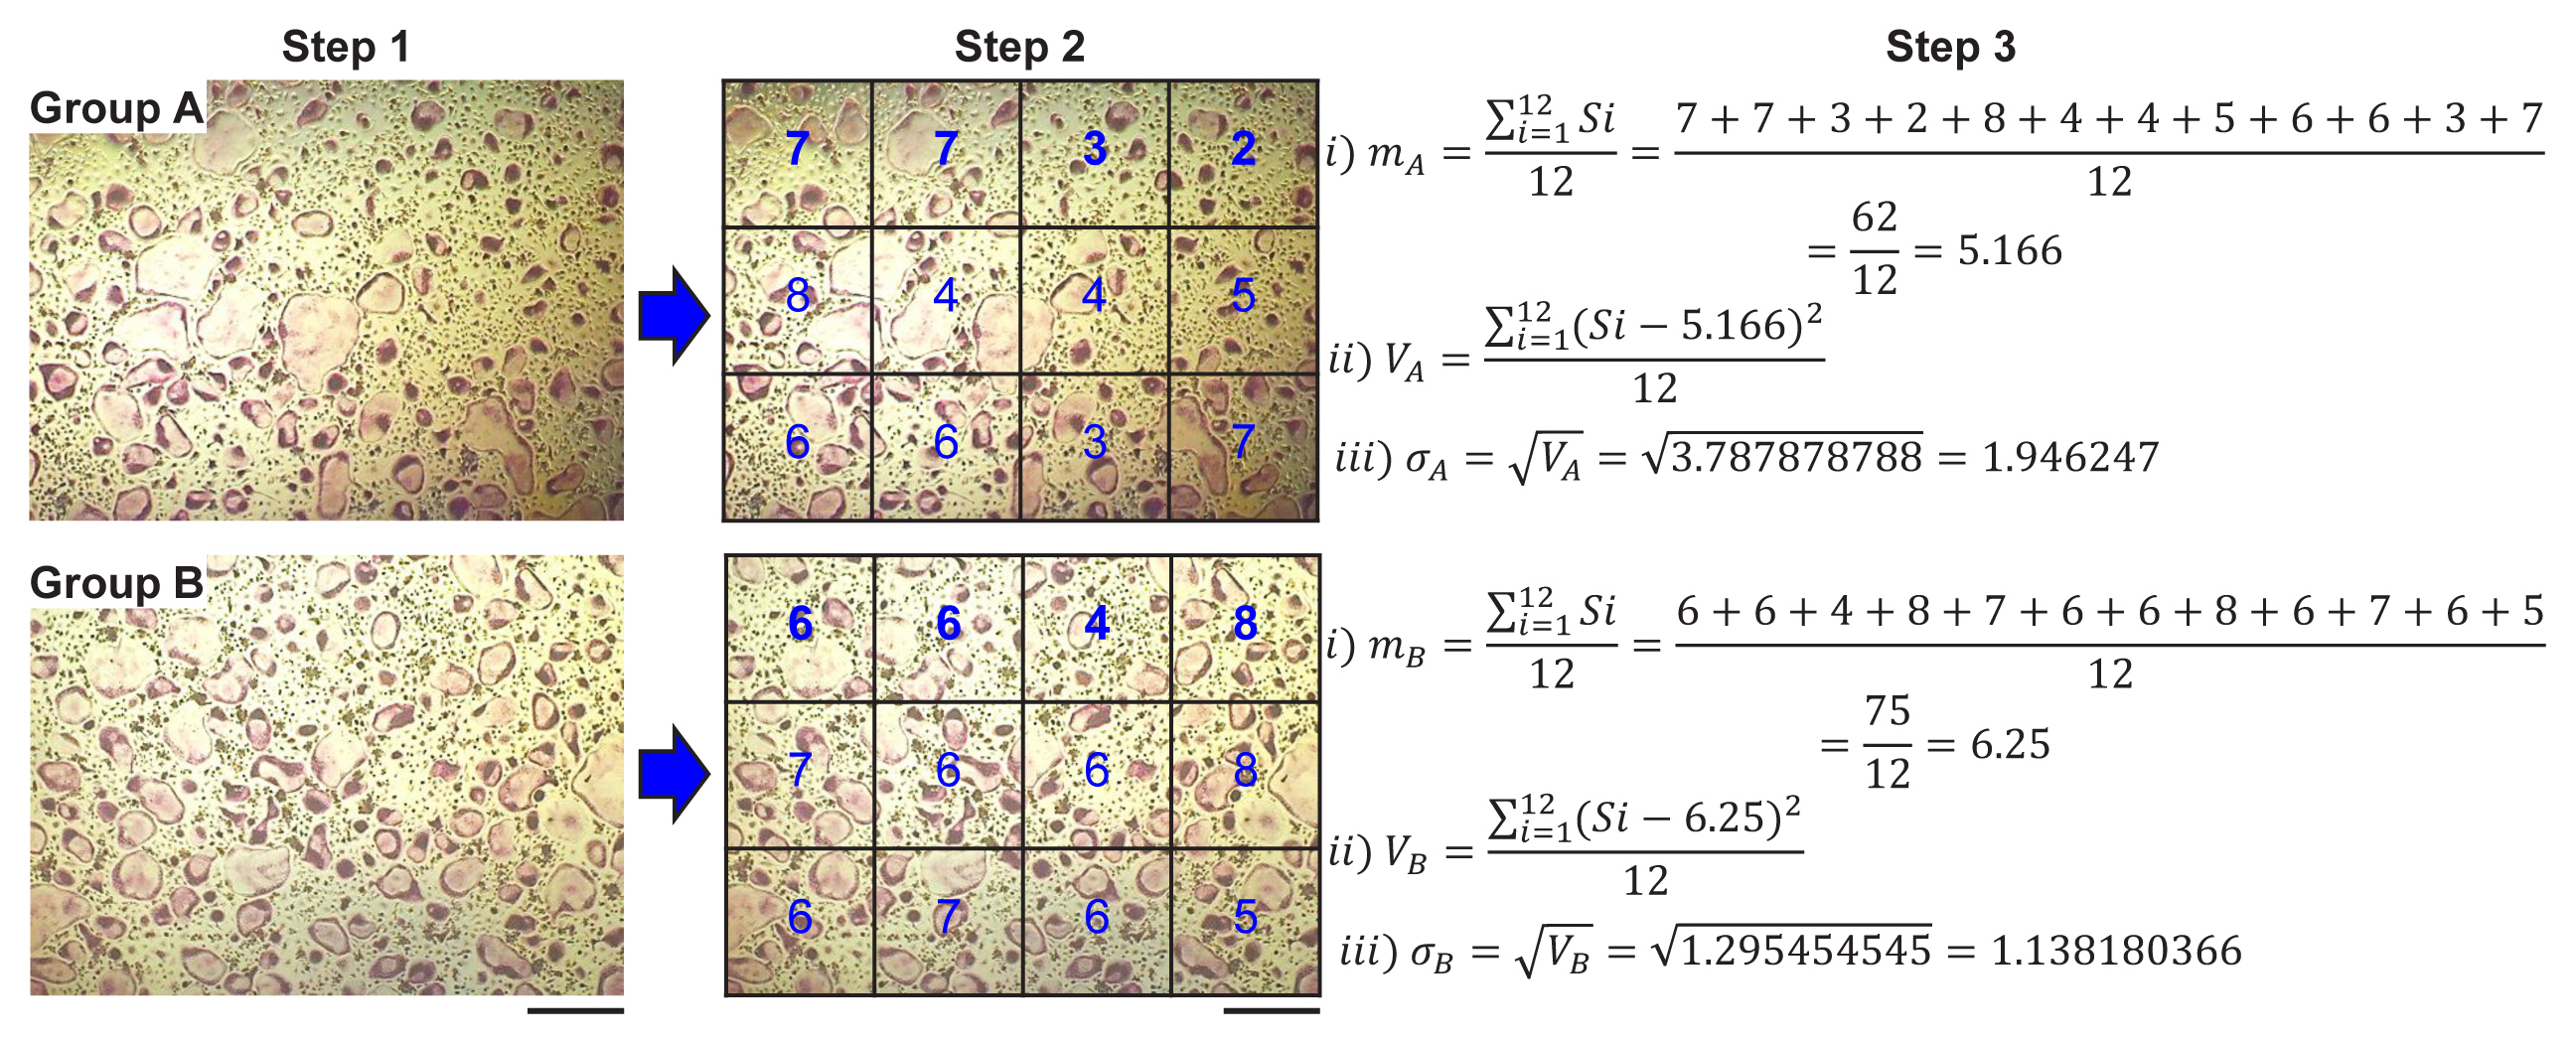
Evaluation for homogenic distribution of differentiated osteoclasts in 2-dimensional culture condition. Osteoclast progenitors of 1×10⁴ cells/well (group A) and 2×10⁴ cells/well (group B) were plated on a 24-well culture plate and cultured in a medium with macrophage colony-stimulating factor (M-CSF) until cell confluence reached approximately 40% (group A) and 60% (group B). Cells were further differentiated into osteoclasts in a medium containing M-CSF and receptor activator of nuclear factor-κB ligand for 4 days with the medium changed after 2 days. Cells formed under different conditions were stained for tartrate-resistant acid phosphatase (TRAP) to detect osteoclasts and were imaged under a light microscope at the same magnification (step 1). The images were divided into sectors and TRAP-positive osteoclasts with more than 3 nuclei within each sector in group A and group B were counted (step 2). The extent of homogenic distribution of osteoclasts in a constant field was assessed through serial calculation of mean (m), variance (V), and standard deviation (σ) (scale bar, 100 μm).
In addition to technical advances that can control the switching between homogeneous and heterogeneous cells, a method capable of determining homogeneity is emerging for achieving a homogeneous assessment. Here, we suggest a useful method for evaluating the homogeneous distribution of specific cells in a 2D area and 3D geometry.
Notes
Funding
This research was funded by the National Research Foundation of Korea, grant numbers NRF-2022R1A2C1002736 and NRF-2022R1A5A2018865.
Conflict of interest
No potential conflict of interest relevant to this article was reported.