Efficacy of Dual Energy X-ray Absorptiometry for Evaluation of Biomechanical Properties: Bone Mineral Density and Actual Bone Strength
Article information
Abstract
Introduction
Bone mineral density (BMD) is an important index in diagnosis of osteoporosis and other metabolic bone diseases, prediction of fractures, and monitoring treatment. This study was to find a more feasible technique for prediction of osteoporotic fracture between dual energy X-ray absorptiometry (DXA) and quantitative computed tomography (QCT) and to reveal the actual change of bone strength when BMD was changed.
Methods
Ten of these 20 specimens were used as the demineralized group and the other 10 as the control. Each specimen was immersed in HCl solution at for a period of at least 10 minutes, up to 100 minutes, at an interval of 10 minutes for different levels of demineralization. BMD was measured using DXA and QCT. Uniaxial compression tests were conducted to measure biomechanical parameters. Pearson correlation analysis was used respectively between BMD and biomechanical parameters and between DXA and QCT.
Results
Elastic modulus (r=0.87) and yield stress (r=0.84) showed a statistically significant correlation with DXA BMD. Through correlation analysis with QCT BMD and elastic modulus, correlation coefficient showed hemi-vertebra (r=0.80) and trabecular (r=0.68). In yield stress, there was a statistically significant correlation in hemi-vertebra (r=0.87) and trabecular bone (r=0.84).
Conclusion
DXA is a current standard technique not only for diagnosis of osteoporosis but also for prediction of fracture risk compared to QCT. Actual decrease of bone strength was much greater than that of BMD by both DXA and QCT.
INTRODUCTION
Osteoporosis is a systemic skeletal disease characterized by low bone mass and deterioration of bone microstructure, leading to bone fragility and susceptibility to fracture.[1] Skeletal sites with high trabecular content, including the spine, proximal femur, and distal radius, are the usual sites of osteoporotic fractures.[2] Occurrence of these fractures is common in the aged, and, in particular, vertebral compression fractures are a major clinical problem involving substantial morbidity and mortality.[3] With extension of the average lifespan, the total number of the population who are affected by osteoporosis is also expected to increase.[4] As a result, prevention and treatment of osteoporosis has emerged as a serious social and financial.
Bone mineral density (BMD) is an important index in diagnosis of osteoporosis and other metabolic bone diseases, prediction of fractures, and monitoring treatment.[5] Despite the fact that there are many tests for measuring BMD, most tests different from each other with regard to which bones are measured for determination of BMD values. Dual energy X-ray absorptiometry (DXA), quantitative computed tomography (QCT), and quantitative ultrasound (QUS) techniques can be used for measurement of BMD. QUS is inexpensive, without radiation exposure so useful as a prescreening tool; however, this technique cannot be used to monitor treatment of osteoporosis.[6]
Due to its low cost, high reproducibility, ease of use, and minimum exposure to radiation, DXA is the most widely used technique for assessment of BMD.[7] Nevertheless, as a technique that measures areal BMD in g/cm2, DXA has a limitation in evaluation of bone geometry and cannot provide a separate bone mass for cortical and trabecular areas. However, QCT, which measures volumetric BMD in mg/cm3, provides information on 3D bone geometry, and enables compartmental bone assessments.
Consequently, in explaining vertebral fractures, it has been argued that QCT has greater sensitivity than DXA.[7] However, compared with DXA, the main disadvantages of QCT include high exposure to radiation for moderately high-resolution, difficulties with quality control, and high cost.[8] Regarding the limitations of these two methods, discussion of the accuracy and difference of the BMD value has been considerable.
A large number of clinical studies have recently reported on comparative analysis of bone density measured by DXA and QCT,[8,9] however, few studies using these two methods have been conducted for analysis of direct correlation between biomechanical properties and BMD.[10] In this experimental study, an artificial demineralization method using HCl solution was employed for simulation of osteoporosis. Axial compression test was performed to evaluate correlation between BMD according to DXA and QCT and biomechanical properties.
The purpose of this study was, First, to find a more feasible technique for prediction of osteoporotic fracture between DXA and QCT, and, Second, to reveal the actual change of bone strength when BMD was changed.
METHODS
1. Cadaveric material
Whole human vertebrae from the eighth thoracic to the fifth lumbar spine were received from the department of anatomy, School of Medicine, Kyungpook National University. Within 72 hours after death, spines were removed from one fresh cadaver (a 69-year-old male) with no condition known to affect bone metabolism. This experimental study was approved by the institutional review board (IRB).
Spines were separated into individual vertebrae. Surrounding musculature, ligaments, periosteum, and intervertebral discs were removed from these 10 vertebrae, and the vertebral spinous process were all cut out. These 10 vertebrae were cut into specimens exactly half of the width for use in biomechanical compression testing of the demineralized and control groups. Prior to cutting into half vertebra, plain radiographs were evaluated in order to confirm that both sides were apparently equal. Ten specimens of hemi-vertebra were included in the demineralized group and the other 10 were used as the control group. Prior to the procedure, all specimens were embedded in 10% formalin solution (Duksan Pure Chemicals Co., Ansan, Korea) for a period of 24 hours. In particular, specimens belonging to the control group were kept in immersion until use in biomechanical testing.
Prior to performance of the demineralization procedure, DXA (anterior-posterior direction) and QCT (transverse plane) were performed for measurement of BMD of all specimens.
2. Demineralization procedure
Ten specimens of the demineralized group were used in performance of the demineralization procedure. In order to simulate osteoporosis with demineralization, each specimen was dipped in 1N HCl (Duksan Pure Chemicals Co., Ansan, Korea) at room temperature. This method for bone demineralization has been described in several other studies.[11,12] Each specimen was immersed in HCl solution at for a period of at least 10 minutes, up to 100 minutes, at an interval of 10 minutes for different levels of demineralization.
After processing, specimens were washed with running distilled water for removal of remaining HCl, followed by immersion in phosphate buffered saline (Duksan Pure Chemicals Co., Ansan, Korea). Specimens were re-embedded in 10% formalin solution for a period of 24 hours prior to conduct of DXA, QCT, and biomechanical studies.
3. Measurement of BMD
DXA (Lunar Prodigy Advance en CORE 2005, GE Lunar, Medison, WI, USA) and QCT scanners (Philips MX 16 CT Scanner 120 kV, 100 mA; Phillips Medical Systems, Eindhoven, Netherlands) with a high-resolution bone algorithm were used for measuring BMD. The absolute values of BMD before and after the demineralization process were measured for each specimen. Decrease of BMD was expressed in differences (%), normal (before demineralization) was counted as 100%. After calibration of densitometry with a set of Ca-HA phantoms for mapping of a standard gray scale, a specimen was placed in a prone positioned in a plastic jar for measuring BMD. QCT was checked at a thickness of 6 mm parallel to the endplates in the longitudinal middle of the specimen. An image analysis program (CIRSCALC-CT Bone; Densitometry version 6.12; Philips Healthcare, Hamburg, Germany) was used for determination of QCT. After completion of measurements, specimens were restored in 10% formalin solution.
1) Biomechanical axial compression testing
Uniaxial compression tests were performed for measurement of elastic modulus and yield stress of specimens of the control group and the demineralized group (10 specimens in each group). Prior to performance of the compression test, assessment of BMD values of the control and demineralized groups was performed. Using a bone saw, for a parallel surface and uniformity of sample size, control and demineralized specimens were cut off in the shape of a cube (approximately 15×10×15 mm3). Cut specimens contained only a trabecular bone (Fig. 1A). Cube-shaped specimens of the control group and the demineralized group were then placed on the axial compression testing machine (Texture Analyzer, TA-HD 1500; Texture Technologies Corp., Scardsale, NY, USA) with one-loaded platen rods in displacement control (Fig. 1B).
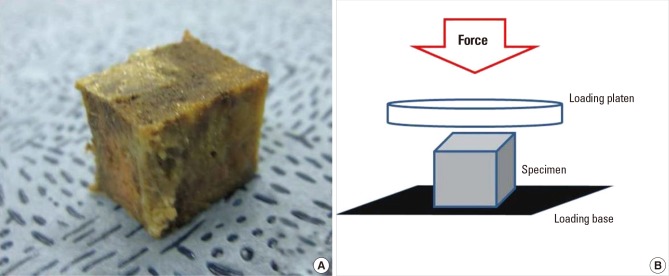
(A) All specimens were cut off (approximately 15×10×15 mm3) in the shape of a cube and (B) were compressed under one-loaded platen rods on an axial compression testing machine in displacement control.
Elastic modulus and yield stress were determined under the axial compression test with a nominal deformation rate of 0.2 mm/second. The modulus was determined as maximum slope in the initial linear region of the stress-strain curve; yield stress was defined as the stress at which a specimen began to show plastic deformation, here the 0.2% offset yield strain method for yield point was used.[13] The specimen was purely trabecular and porous in structure, therefore, evaluation of ultimate stress could not be performed.
4. Statistical analyses
SPSS software (ver. 18.0 for Windows; SPSS Inc., Chicago, IL, USA) was used in performance of all statistical tests. Scientific Data Analysis and Graphing Software (SigmaPlot, version 10.0; Systat Software Inc., Chicago, IL, USA) was used in performance of statistical linear regression analysis. The independent t-test was used for mean comparison between BMDs using DXA and QCT. Percent decrements were used to describe differences between before and after in the demineralized group and between the control and demineralized groups.
Pearson correlation analysis was used to determine correlation between DXA and QCT and between BMD and biomechanical properties. Results were expressed as means±SD, and a P-value below 0.05 indicated statistical significance.
RESULTS
1. BMD of DXA and QCT
The difference of DXA BMD with passage time according to standard value of undemineralization (100%) was measured; results showed a significant decrease every 10 minutes, approximately 3.20%, respectively (R2=0.95). The difference of QCT BMD showed a significant decrease every 10 minutes, approximately 4.57% (R2=0.78) in hemi-vertebral, 4.44% (R2=0.61) in trabecular, respectively. The QCT BMD was check on hemi-vertebral and trabecular bone because cortical bone is very few in each specimen.
2. Biomechanical axial compression test
As shown in Table 1, results of an independent t-test indicated significant correspondence for both groups. Mean values of DXA hemi-vertebral BMD were 0.39±031 in the control group and 0.39±0.37 g/cm2 in the future-demineralized group, QCT hemi-vertebral BMD was 57.60±22.40 and 58.24±22.70 mg/cm3, respectively.

Summary of dual energy X-ray absorptiometry and quantitative computed tomography bone mineral density values of specimens, undemineralized two (control and demineralized) group
Biomechanical parameters (elastic modulus and yield stress, megapascals [MPs=N/mm2]) of the control group and the demineralized group were determined. Differences in two parameters with passage of time were measured according to the standard value of the control group (100%); results showed a significant decrease every 10 minutes, approximately 2.78% (R2=0.78), in elastic modulus and 2.97% (R2=0.65) in yield stress, respectively.
3. Pearson correlation analysis
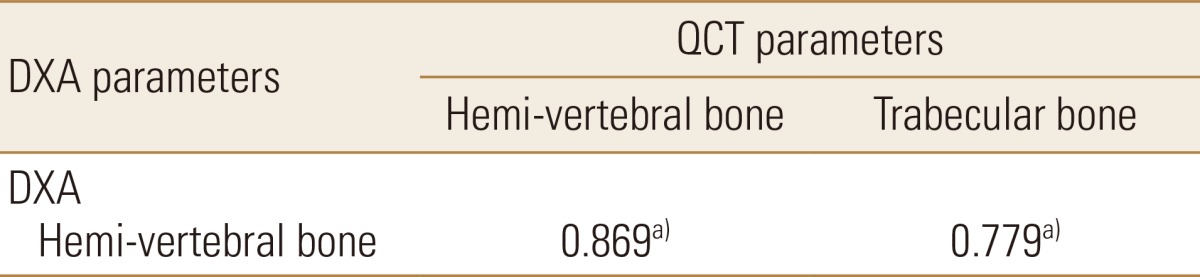
As demineralization was going on with time of digging into HCl, Pearson correlations between parameters of DXA and QCT BMD are listed in Table 2. A statistically significant correlation was observed between the parameters (correlation coefficient; r=0.87 in DXA and QCT hemi-vertebral, r=0.78 in DXA and QCT trabecular bone) (Fig. 2A, B).
Pearson's correlation coefficient between dual energy X-ray absorptiometry bone mineral density (BMD) and quantitative computed tomography BMD parameters (%) as progressive demineralization time
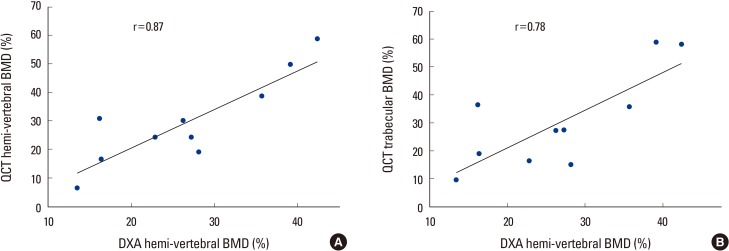
The graphs showed a strong correlation (A) between quantitative computed tomography (QCT) hemi-vertebral bone mineral density (BMD) and dual energy X-ray absorptiometry (DXA) BMD (r=0.87), (B) QCT trabecular and DXA BMD (r=0.78) as time progression.
Elastic modulus (r=0.88, P<0.01) and yield stress (r=0.84, P<0.01) showed a statistically significant correlation with DXA BMD. In QCT BMD, Elastic modulus showed high correlation coefficient (r=0.81, P<0.01 in hemi-vertebral and r=0.68, P<0.05 in trabecular bone). With yield stress, a statistically significant correlation was observed in hemi-vertebral (r=0.87, P<0.01) and trabecular bone (r=0.84, P<0.01) (Table 3).
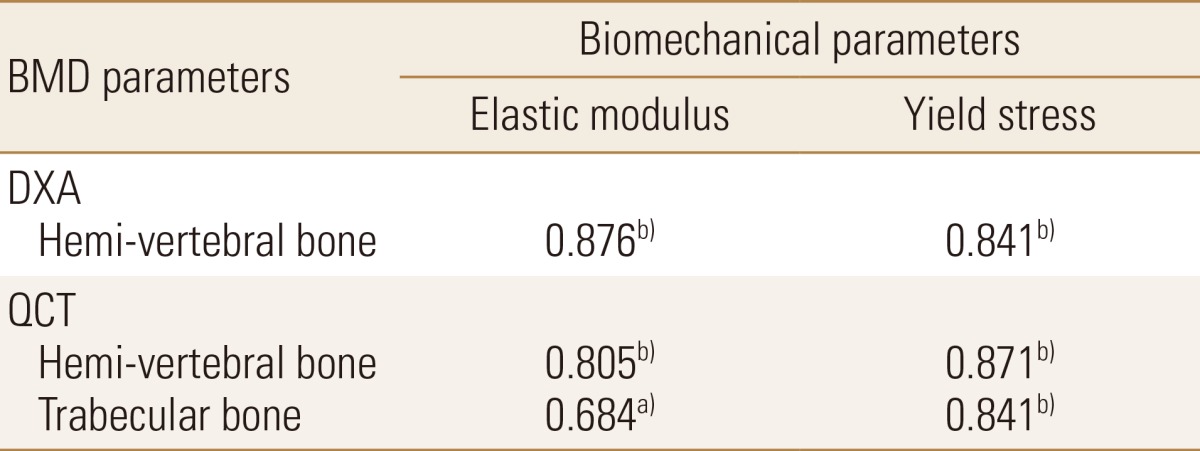
Pearson's correlation coefficient between bone mineral density and biomechanical axial compression parameters (%) as progressive demineralization time
DISCUSSION
DXA and QCT have been widely used for measuring BMD. As a test reading fracture risk assessment, DXA is most valid test;[14] however, in explaining vertebra fractures, greater sensitivity of QCT, compared with DXA, has been reported.[7] In this study, statistically significant correlation was observed between DXA and QCT (r=0.87) (Table 2). Throughout the entire process of simulation of bone loss as progressive demineralization time, a strong relationship has been observed between the two devices. According to findings of some research studies, BMD values of DXA and QCT, as a whole, showed a statistically significant relationship (r=0.66).[15]
Use of QCT has resulted in some progress in separation of bone density into hemi-vertebral, cortical, and trabecular bone density. Findings of this study demonstrated statistically strong correlation between hemi-vertebral and trabecular BMD (r=0.96), higher than that between hemi-vertebral and cortical (r=0.72) in QCT. The vertebral body consists of trabecular and cortical bone, and trabecular bone is 60-70% of total bone. Therefore, bone loss of vertebra represents reduction of BMD of trabecular bone.[16]
Prior to performance of the axial compression test, all specimens were cut off in the shape of a cube in order to provide a flat surface for application during the test. Thus, the cut specimens contained only a trabecular bone. Microstructure, density, and mechanical properties of trabecular bone are strongly dependent on loading direction; therefore, in consideration of the anisotropy of trabecular bone, all specimens were compressed in the same direction.[17]
To a great extent, variance in mechanical properties (modulus, strength) of trabecular bone can be explained by apparent density. Apparent density explains approximately 60% of the variance in modulus and strength of trabecular bone.[18] In addition, some research studies have reported a high correlation (R2=0.9) between BMD and the mechanical properties of bone.[19,20]
In order to obtain these mechanical properties, the test was also performed in this study. Fracture risk can be defined as the ratio between the load under particular loading conditions and the ultimate load supported by bone strength.[21] Unfortunately, because the specimen was porous as a result of progressive demineralization, evaluation of ultimate stress could not be performed. Therefore, all specimens were evaluated for elastic modulus and yield stress.
In analysis of correlation between biomechanical parameters and BMD using DXA and QCT, elastic modulus and yield stress showed statistically significant correlation with DXA and QCT BMD (Table 3).
In this study, all findings of DXA and QCT BMD showed high correlation with elastic modulus. Because mineral content and hardness are strongly related, a relationship between hardness and elastic modulus in trabecular bone has also been suggested.[22] Compared with the control group, elastic modulus showed a significant decrease of approximately 30% (R2=0.65) for every 10 minutes of demineralization, respectively. For example, a 30% decrease of BMD according to findings on DXA and QCT indicates a 65% decrease of elastic modulus in a cadaveric vertebra (Fig. 3A).

The graphs showed a strong correlation (A) between elastic modulus (r=0.88) for dual energy X-ray absorptiometry (DXA) bone mineral density (BMD) and (B) yield stress and quantitative computed tomography (QCT) hemi-vertebral BMD (r=0.87) as time progression.
DXA and QCT BMD showed high correlation with yield stress, which could reflect the failure force of the compression fracture. A significant decrease in yield stress was observed every 10 minutes during the demineralization process, approximately 28%, respectively (R2=0.78). Ultimately, when a 30% decrease of BMD was observed according to findings of DXA and QCT, yield stress showed a decrease of approximately 40% in cadaveric vertebra (Fig. 3B).
This experimental study was designed for determination of which technique is better for prediction of an osteoporotic vertebral compression fracture. Several authors have reported that DXA had limitation on geometric and structural information; DXA cannot predict fracture risk.
However, according to findings of this study, both DXA and QCT BMD showed strong correlation with biomechanical properties in cadaveric thoraco-lumbar vertebra. Therefore, DXA could be as predictive of fracture risk as QCT. In addition, DXA is inexpensive, involves a very low dose of radiation (effective dose of less than 0.01 millisievert [mSv]), and is considered as economical for use in management of bone disease.[23] Findings of this study demonstrated the potential for use of DXA as a current standard clinical technique, not only for diagnosis of osteoporosis, but also for prediction of fracture risk.
Studies of bone loss and spinal implant of osteoporotic vertebra are important in the effort to gain an understanding of bone biomechanics and for development of instruments.[24] Results of one biomechanical animal study have demonstrated an association of mean tissue density and compressive strength of calf spines with a young healthy human spine.[25] Hence, in experimental study, animal spines are used as a substitute for human cadaveric specimens. However, an animal model has limitation for simulation of severe osteoporosis.[26]
This study was conducted for simulation of osteoporosis through a cadaveric spine and analysis of the association with BMD and biomechanical properties. In addition, the current study demonstrated creativity by cutting each vertebra for in order to rule out cadaveric heterogeneity, which was inadequate, such as heterogeneity from a biomechanical perspective.
In this study, despite the small number of specimens, there was no shortage of specimens for establishment of statistical results. In addition, biomechanical testing was only performed on trabecular bone. Additional studies using long bone containing large amount of cortical bone for determination of fracture risk of cortical bone are needed. For the future, a large number of cadaveric and large scale clinical studies will be required.
This study demonstrated the relationship between biomechanical parameters and BMD measured using DXA and QCT. Both DXA and QCT showed strong correlation with biomechanical parameters in cadaveric vertebra. Therefore, DXA and QCT showed equivalent accuracy and persistency for prediction of vertebral fracture risk. Findings from this study indicate the potential for use of DXA as a current standard clinical technique, not only for diagnosis of osteoporosis, but also for prediction of vertebral fracture risk, when compared to the QCT technique. In addition, actual decrease of bone strength was much greater than that of BMD by both DXA and QCT.
Notes
No potential conflict of interest relevant to this article was reported.