


INTRODUCTION
Calcium is the most abundant mineral in the body, and the calcium content of the adult human body takes for about 1.5% to 2.0% of the body weight.[1] Calcium is the most notable nutrient related to bone health and plays important roles in muscle contraction, nerve transmission, regulation of cell membrane permeability, and blood clotting.[2,3] Insufficient calcium intake may lead to osteoporosis,[4] hypertension, stroke,[5] or premenstrual syndrome.[6] However, insufficient calcium intake has been very common in Korea and other countries. According to the 2013 Korea National Health and Nutrition Examination Survey (KNHANES), the calcium intake of adults in Korea was found to reach only 70% of the recommended calcium intake for adults, and only 17.8% of the population was found to consume calcium at adequate levels. In addition, calcium intake was shown to be lower in elderly persons aged 65 years or older, young persons aged 12 to 18 years, and in females.[7] The 12 major food sources of calcium are milk, anchovy, kimchi, tofu, radish leaves, sea mustard, yogurt, eggs, green onions, soybeans, bread, and sesame, accounting for 50% of the total calcium intake.[8]
The results of the National Health and Nutrition Examination Survey (NHANES) in the United States indicated that there was a severe deficiency of calcium intake among female youths and preschool children from low-income families, which has been raised as a nutritional issue.[9] The dietary pattern or nutrient intake is known to be greatly affected by socioeconomic factors.[10] High socioeconomic status (SES) was also associated with higher fruit and/or vegetable consumption, diet quality, and diversity.[10]; that food insecurity and dietary quality were related to income; and that food insecurity was expected to increase the risk of chronic diseases.[11]
The status of nutrient intake of Koreans has been reported by KNHANES, which was examined by sex, age, and region; however, studies of nutrient intakes and their qualitative assessment by region of the country are lacking. In this regard, this study was done to compare the intake of calcium as one of major minerals, and its qualitative assessment, by region; to examine the differences depending on SES by using the original data of KNHANES; and thus to provide basic data that can be used to resolve nutritional imbalance by region.
METHODS
1. Subject
This study was conducted by using raw data of the 2011 to 2013 KNHANES. The total number of subjects were 24,594, from whom children under 7 years of age (n=1,885) and subjects with missing calcium and energy intakes (n=2,579) as well as those with missing answers to all the variables used in this study (n=881) were excluded. A total of 19,249 subjects were included in the final analysis. In the original data, the survey area was divided into 17 cities and provinces, and the analysis data were presented in big cities, small- and medium-sized cities, and eup-myeon areas (or rural areas). In this study, for regional comparisons, the country area was divided into six regions: Seoul and Gyeonggi-do (Seoul, Gyeonggi, Incheon), Gangwon-do (Gangwon), Chungcheong-do (Daejeon, Chungbuk, and Chungnam), Jeolla-do (Gwangju, Jeonbuk, and Jeonnam), Gyeongsang-do (Busan, Daegu, Ulsan, Gyeongbuk, and Gyeongnam), and Jeju-do.
2. Description of the parameter
The subvariables used in this study were referred to the KNHANES User's Guide and were set by using items of its health screening survey and nutrition survey sections. The variables used for the analysis of subjects were sex, age (actual age: 8 to 13, 14 to 19, 20 to 29, 30 to 49, 50 to 64, and 65 years or older), household income (low, middle-low, middle-high, and high), and being recipients of the national basic livelihood security supply and dietary life supply.
3. Calcium intake and dietary quality
Data on calcium intake amount was analyzed using the 24-hr recall method. The nutrient adequacy ratio (NAR) was calculated to assess the appropriateness of calcium intake. Nutrient density (ND) was calculated by standardizing the calcium intake per 1,000 kcal based on the individual's intake amount.[12]
4. Statistical analysis
The mean and standard deviation (SD) were calculated using SPSS software program ver. 18.0 (SPSS Inc., Chicago, IL, USA). All data were reported as mean±SD or as numbers and percentages. Groups comparisons used Chi-square tests for qualitative variables and two-way analysis of variance (ANOVA) for quantitative variables. In this study, there were no interaction effect between region and general characteristics for measurement values related to calcium intake. Thus, one-way ANOVA was conducted for region and general characteristics, respectively. If there seemed to be a significant differences, post hoc comparison was applied by Bonferroni's method. A two-tailed P-value of less than 0.05 was considered statistically significant. All statistical analyses were performed using R 3.1.3 version freely available on the web (http://cran.r-project.org/) and SPSS (version 18.0; SPSS Inc., Chicago, IL, USA).
RESULTS
1. Distribution of study population
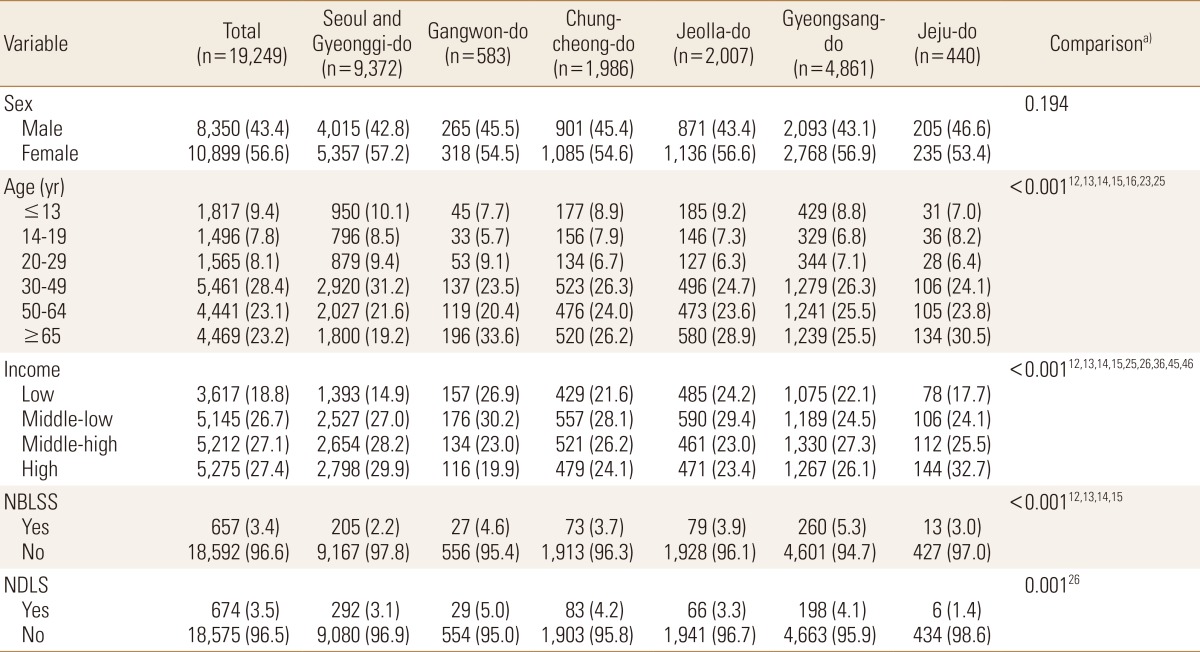
With regard to the distribution of the total subjects, there were 43.4% males and 56.6% females, showing a higher female ratio in all six regions. The age distribution was as follows: 9.4% elementary school students, 7.8% youths, 8.1% in their 20s, 28.4% in their 30 to 40s, 23.1% in their aged between 50 and 64 years and 23.2% aged 65 years or older; the ratio of elderly people aged 65 years or older was higher in Gangwon-do and Jeju-do than in the other regions. In terms of household income quartile, the region with the highest proportion of low household income was Gangwon-do (26.9%). The proportion of recipients of the national livelihood security supply was 3.4% of the total subjects. The region with the highest proportion of recipients of the national livelihood supply was Gyeongsang-do (5.3%), whereas the regions with the lowest proportions were Seoul and Gyeonggi-do (2.2%). The proportion of recipients of the national dietary life supply was 3.5% on average. The region with the highest proportion of recipients of the national dietary life supply was Gangwon-do (5.0%), whereas the region with the lowest proportion was Jeju-do (1.4%) (Table 1).
2. Comparison of calcium intake status by the age and sex
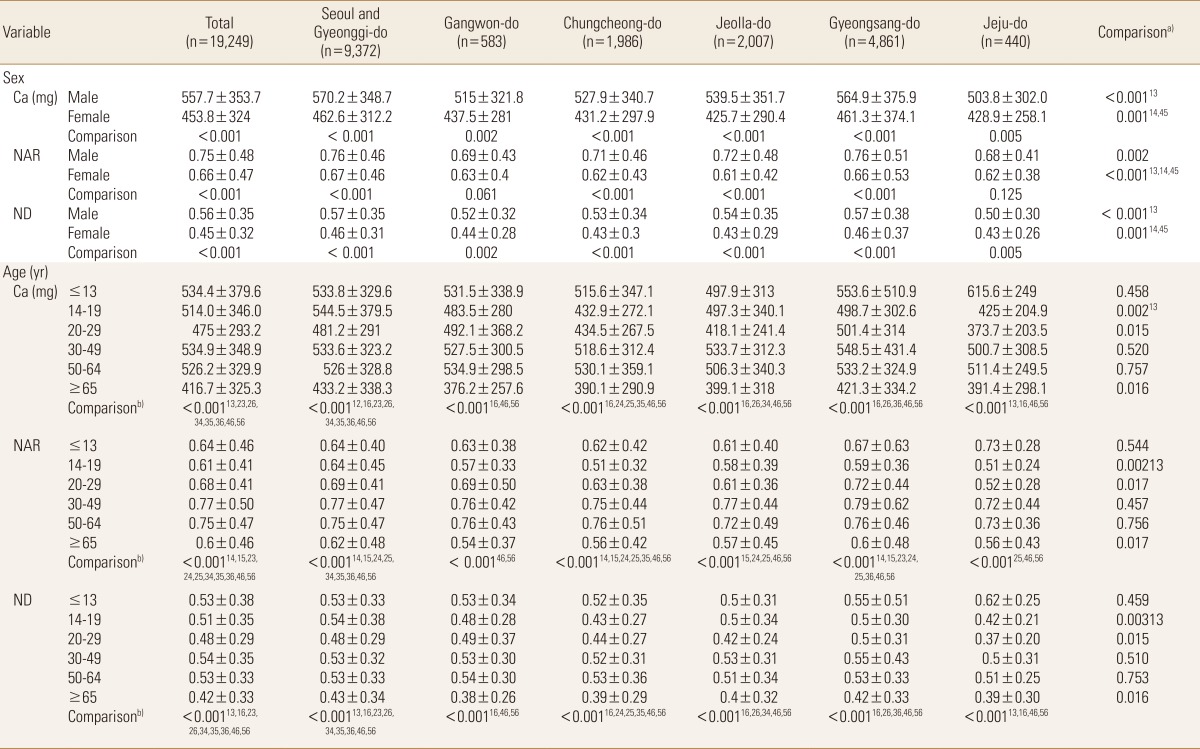
Calcium intake and its quality assessment by sex and age are shown in Table 2. The regions with the highest calcium intakes in both males and females were Seoul and Gyeonggi. The NAR of calcium showed similar results; however, the ND of calcium in both sexes was highest in Gyeongsang-do. The NAR of calcium was <0.7 in all age groups except for those in their 30s to 40s and those aged 50 to 64 years, and was 0.61 in youths aged 14 to 19 years (i.e., the lowest NAR). The age groups with a significant difference in calcium intake, NAR, and ND by region were 14 to 19, 20 to 29, and ≥65 years. The age group with the lowest NAR was 14 to 19 years in Chungcheong-do and Jeju-do, and the age group with the lowest ND was 20 to 29 years in Jeju-do (Table 2).
3. Comparison of calcium intake status by the SES
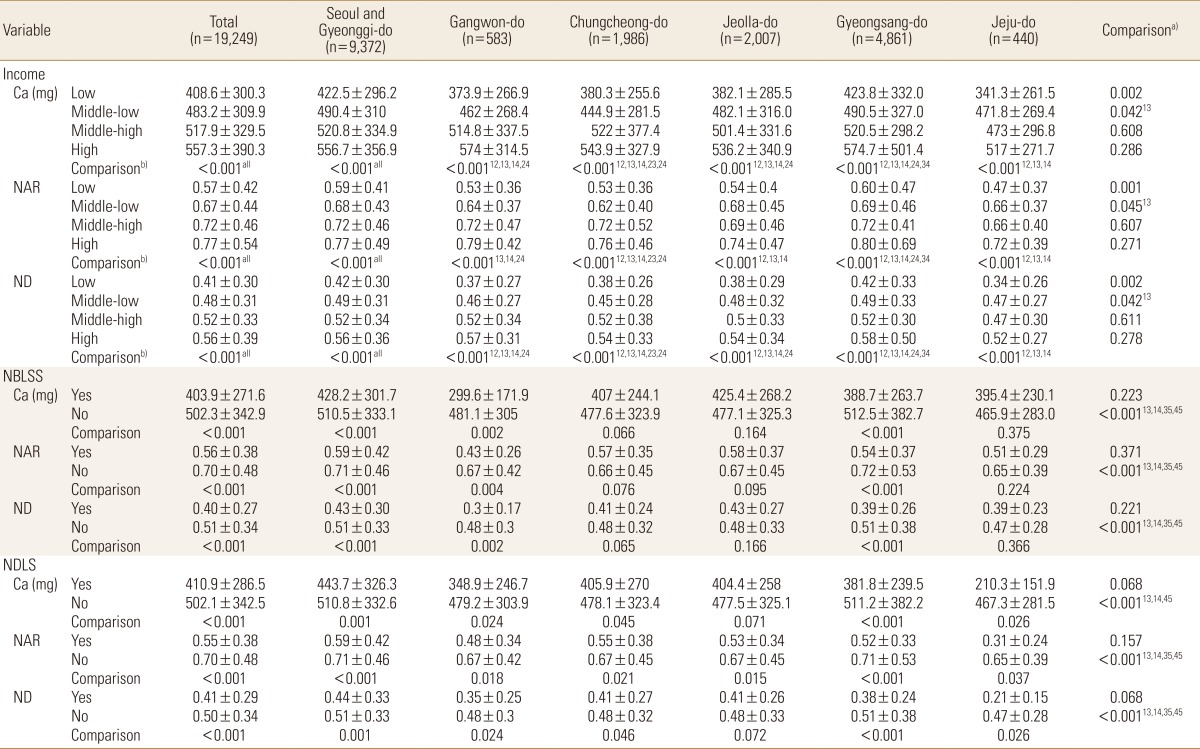
In terms of household income, calcium intake and dietary quality of calcium were lowest in the low household income group; however, as the household income increased, the calcium intake or dietary quality of calcium also tended to increase. The low household income group in Jeju-do showed the lowest NAR and ND, whereas the high household income group in Gyeongsang-do showed the highest NAR and ND. When analyzed in terms of the national basic livelihood security supply, the recipient groups showed no significant difference in calcium intake and dietary quality by region. However, in the case of the recipients of the basic livelihood security supply in Gangwon-do, the average calcium intake was very low (299.6 mg). In terms of being a recipient of the dietary life supply, the calcium intake and dietary quality of calcium in the recipient group was low. The average calcium intake of such recipient group in Jeju-do was 210.3 mg, the lowest among all intakes by variable; moreover, their NAR was also very low (0.31; Table 3).
4. Comparison of the lowest calcium intake status by region
The lowest calcium intake variables and the calcium intakes ratio versus the recommended calcium intake by region are presented in Figure 1. The average age of subjects with the lowest calcium intake variables was 61.6±5.3 years, and the ratio of average calcium intake to the recommended calcium intake was shown to be 48.7%. The calcium intakes were shown to be lowest in the low household income groups for Seoul and Gyeonggi-do, Chungcheong-do, and Jeolla-do, in the basic livelihood security supply recipient group for Gangwon-do, and in the dietary life supply recipient groups for Gyeongsang-do and Jeolla-do (Fig. 1).
DISCUSSION
Calcium intake is very important from the nutritional perspective. In some recent studies, the lack of adequate calcium intake of children and young adults, rather than middle-aged persons, has been pointed out as an issue.[13] In fact, as an inadequate calcium intake of infants and children may result in insufficient calcification of bone thereby delaying normal growth and leading to the early onset of osteoporosis in later adulthood, the importance of sufficient calcium intake is highly emphasized.[14] In the United States, a diet habit change initiative designed to increase the calcium intake of American people has been driven at the national level.[15] The age group of 20 to 29 years among the subjects of this study had a low average calcium intake, whereas the age group of 14 to 19 years had a low NAR, showing a difference. Both age groups showed significant differences in calcium intake and NAR by region. These results were similar to the calcium intake reported by Choi et al.,[16] and were consistent with the results of a study by Chung,[17] showing that the rate of insufficient calcium intake was highest in youths aged 12 to 19 years. It is necessary to develop practical measures to increase the calcium intake of adolescents, who have the highest calcium requirements, in view of the fact that the calcium intake of adolescents remains insufficient.
A balanced diet is related to the intake of a variety of foods and to dietary quality. As the diversity of diet is increased, the quality of nutrition may also increase. Therefore, the quality of diet that influences the nutritional status may need to be evaluated according to economic conditions. Kim [18] reported that the most important factor affecting Koreans' food nutrient intake patterns was found to be monthly household income and educational level. The socioeconomic factors used in this study included household income, and being recipients of the national basic livelihood security supply and national dietary life supply; it was found that the calcium intake by income level observed in this study was lower compared with the results of a study by Moon and Kim.[19] The national basic livelihood security scheme is a public aid system and is a social safety net in which a salary set by the relevant law is paid to applicants whose household income does not meet the minimum cost of living.[20] The dietary life supply program is somewhat a duplicate of the basic livelihood security scheme with regard to the baseline conditions. The recipients of the two government-operated systems were found to have a lower calcium intake than nonrecipients, and the calcium intake of the subjects in this study was found to be lower when compared with 421 mg, the calcium intake of the scheme recipients resulting from a survey conducted by the Korea Rural Economic Institute.[21] The percentage of individuals who were undernourished among the recipients of the basic livelihood security supply was 28.7%. Although food expenses accounted for the highest proportion of the living expenses paid to the recipients, the problem of undernourishment remains unresolved because the actual form of benefit provision is consolidated and money for food is being spent for other uses. According to a report by the Korea Rural Economic Institute,[21] the calcium intake of the recipients of the basic livelihood security supply was severely lacking at only 53.7% of the recommended amount, and their intake levels of meat and milk were low. While the major source of calcium is milk and dairy products, previous reports have indicated that lower income levels are associated with a significantly lower intake of dairy products in Koreans.[22] This study found that the calcium intake rate in the recipients of the basic livelihood security supply was approximately 56%, still showing no improvement. Interestingly, recipients of non-basic livelihood security supply showed significant differences by region, which is presumed to be affected by demographic factors including age and household number. Therefore, diverse nutrition support systems may need to be selectively operated.
This study has limitations. First, sex or age factors were not adjusted in comparisons depending on economic level by region. In addition, this study was done to assess a single nutrient rather than being a comprehensive nutrient assessment, and not to thoroughly investigate the prevalence of diseases associated with excessive or deficient calcium intake. However, in conclusion, it was found that the calcium intake of Korean people was still insufficient compared with the recommended calcium intake, and the calcium intake of young adults, elderly people, and those in the low-income bracket was markedly low. Moreover, there were great deviations in calcium intakes by region. It is thought that selective and aggressive nutrition support policy should be devised for nutritionally vulnerable groups by region, and that continuous and diverse studies are required.

 PDF Links
 PubReader
 ePub Link
 Full text via DOI
 Full text via PMC
 Download Citation
 Print
Print