The Fracture Risk Assessment Tool Probability and Trabecular Bone Score Mediate the Relationship between Sphingosine 1-phosphate Levels and Fracture Risk
Article information

Abstract
Background
The sphingosine 1-phosphate (S1P) concentration is a potential biomarker of osteoporotic fracture and is associated with both the fracture risk assessment tool (FRAX) probability and trabecular bone score (TBS), which are well-known predictors of fracture. We sought to estimate the effect of the S1P concentration on fracture risk using the FRAX probability and TBS as mediators.
Methods
Plasma S1P concentrations, FRAX variables, and TBSs were measured in 66 postmenopausal women with fractures and 273 postmenopausal women without fractures. Associations between S1P concentration, FRAX probability, TBS, and fracture risk were analyzed using correlation, logistic regression, and mediation analyses.
Results
Subjects in the highest S1P concentration tertile had a higher fracture risk (odds ratio [OR], 5.09; 95% confidence interval [CI], 2.22–11.67) than those in the lowest S1P concentration tertile before adjustment. Subjects in the highest FRAX probability tertile had a higher fracture risk (OR, 14.59; 95% CI, 5.01–42.53) than those in the lowest FRAX probability tertile before adjustment. Subjects in the lowest TBS tertile had a higher fracture risk (OR, 4.76; 95% CI, 2.28–9.93) than those in the highest TBS tertile before adjustment. After adjustment for FRAX probability and TBS, the highest S1P concentration tertile was still associated with a higher fracture risk (OR, 3.13; 95% CI, 1.28–7.66). The FRAX probability and TBS accounted for 32.6% and 21.7%, respectively, of the relationship between the S1P concentration and fracture risk.
Conclusions
The relationship between the circulating S1P concentration and fracture risk was partly mediated by the FRAX probability, bone microarchitecture, and other factors.

INTRODUCTION
Osteoporosis is a skeletal disease characterized by compromised bone strength reflecting the combination of bone mass and bone quality including deterioration of bone microarchitecture, which increases fracture risk.[1] The operational definition of osteoporosis is based on a T-score ≤−2.5 for bone mineral density (BMD) measured using dual energy X-ray absorptiometry (DXA).[2,3] Low BMD is the most robust predictor of fracture risk. However, BMD alone is inadequate to predict fracture risk. Approximately 2-thirds of people who sustain fractures do not have osteoporosis according to the BMD criteria.[4,5] Therefore, the fracture risk assessment tool (FRAX; www.shef.ac.uk/FRAX) [6] and trabecular bone score (TBS) [7–9] were suggested to improve the accuracy of fracture risk prediction.
FRAX incorporates multiple clinical risk factors (CRFs) that predict fracture risk, largely independent of BMD and BMD at the femur neck (FN-BMD, when available).[6] FRAX incorporating CRFs and/or FN-BMD calculates the 10-year probability of major osteoporotic fracture (hip, clinical spine, humerus, or forearm) and hip fracture. The area under the receiver operating characteristic (ROC) curve (AUC) of FRAX probabilities derived from CRFs and FN-BMD for major osteoporotic fractures had a median value of 0.69 in recent validation studies.[10] The TBS is a gray-level textural index of trabecular microarchitecture derived from DXA images of the lumbar spine (LS), and a lower TBS reflects deteriorated bone microarchitecture and is associated with fractures.[7–9] Recent studies reported that the TBS is associated with fractures independent of the FRAX probability.[8, 11,12] Therefore, both the FRAX probability and TBS are well-known predictors of fracture.
In vitro and in vivo experiments have shown that sphingosine 1-phosphate (S1P), a natural bioactive lipid molecule, affects bone formation through osteoblasts [13–15] and bone resorption through osteoclasts.[16–18] In humans, a higher plasma S1P level is associated with higher levels of bone resorption markers and lower BMD, but not with the level of a bone formation marker,[19] suggested that circulating S1P levels are predominantly associated with bone resorption rather than bone formation. Furthermore, a higher S1P level is associated with a higher fracture risk, independent of BMD.[20–22] Taken together, these results suggest that the circulating S1P level is associated with factors other than BMD that influence bone strength and fracture risk, including the FRAX probability and TBS. Recent studies showed that the circulating S1P level is associated with both the FRAX probability derived from only CRFs (r=0.106, P=0.032) and CRFs and FN-BMD (r=0.153, P= 0.002), for major osteoporotic fracture,[23] and with the TBS (r=−0.096, P=0.049).[24] Although FRAX probability and TBS are associated with fracture risk, the relationship between the S1P level, FRAX probability, TBS, and fracture has not been investigated. To explore this, the present study sought to estimate the effect of the S1P level on fracture risk, with the FRAX probability and TBS acting as mediators.
METHODS
1. Study participants and protocol
The study population consisted of consecutive ambulatory postmenopausal women who visited the osteoporosis clinic of Asan Medical Center (AMC; Seoul, Korea) between January 2010 and October 2017. All subjects had visited an osteoporosis clinic due to concerns about possible osteoporosis or were referred to the clinic for osteoporosis detected during a routine examination. Menopause was defined as the absence of menstruation for at least 1 year and was confirmed by measuring serum concentrations of follicle-stimulating hormone. Participants were excluded if they had taken medications that could affect bone metabolism within the past year or for more than 6 months (e.g., hormone-replacement therapy, systemic glucocorticoids, or bisphosphonates); if they had preexisting diseases that could affect bone metabolism (e.g., hyperthyroidism, hypothyroidism, hyperparathyroidism, hypoparathyroidism, rheumatoid arthritis, asthma, chronic obstructive pulmonary disease, solid or hematologic malignancy, diabetes, or major cardiovascular diseases); if they had osteophyte formation higher than Nathan classification grade 4 and/or severe facet joint osteoarthritis in LS radiographs; if they had a fever (oral temperature ≥38.0°C) or an abnormal number of leukocytes (<4.0 or >10.0×10⁹/L) or platelets (<150 or >350×109/L) on complete blood counts; or if they had abnormal liver, kidney, or thyroid function, or an abnormal serum concentration of calcium, phosphorus, or alkaline phosphatase. This study included 339 postmenopausal women.
Patient information was obtained using a self-administered questionnaire, which assessed smoking status (current smoker or not), alcohol use (≥3 or <3 units/day), regular outdoor exercise (≥30 or <30 min/day), history of medication use, previous medical or surgical procedures, and reproductive status (including menstruation). Information was also collected about parental history of fragility hip fractures to exclude all fractures that could be considered non-osteoporotic (i.e., fractures due to cancer or an accident, such as a motor vehicle accident, and all fractures of the fingers, face, skull, and toes). This study was approved by the AMC Ethics Review Committee. Informed consent was obtained from all individual participants included in the study.
2. Calculation of FRAX probabilities derived from CRFs and BMD
FRAX probabilities derived from CRFs and FN-BMD for major osteoporotic fracture were calculated using Korea-specific models (FRAX version 4.1). Included CRFs were age, sex, weight, height, previous fracture, parental history of hip fracture, current smoking, pre-menopause as a cause of secondary osteoporosis, and alcohol intake (≥3 U/day). Subjects who used glucocorticoids or who had rheumatoid arthritis and another cause of secondary osteoporosis except for pre-menopause were excluded; therefore, questions about these CRFs were answered as “no”.
3. Measurement of BMD and TBS
Areal BMD (g/cm2) was measured at the LS (L1–4; LS-BMD) and FN-BMD using DXA (Lunar system running software version 9.30.044; Prodigy, Madison, WI, USA). The precision of the equipment, as determined by its coefficient of variation (CV) in 17 volunteers who were not enrolled in the study, was 0.67% for LS-BMD and 1.25% for FN-BMD. Each volunteer underwent 5 scans on the same day and got off the table between scans. The TBS was retrospectively analyzed from LS DXA scans using iNsight software (version 3.0.2.0; Med-Imaps, Pessac, France) on the same regions of interest as those used to determine LS-BMD. Preexisting LS DXA files were anonymized to ensure the investigators were blinded to all clinical parameters and outcomes. Regions of interest were automatically generated by the DXA system and adjusted by the technologist as necessary. Instruments were calibrated using TBS phantoms in accordance with the manufacturer’s instructions. The CV of the LS TBS was 1.1%.
4. Assessment of fracture
Lateral thoracolumbar radiographs were obtained from all participants to evaluate the morphological vertebral fracture (VF). VF was quantitatively defined as a >20% reduction in any vertebral height measurement (i.e., anterior, middle, or posterior) [25] in accordance with the recommendations of the Working Group on VFs.[26] Nonvertebral fracture (NVF) at major osteoporosis-associated locations (i.e., the hip, distal radius, and proximal humerus) was assessed using a self-administered questionnaire. Low-trauma fractures after menopause were only included after the exclusion of fractures that were clearly caused by major trauma, e.g., motor vehicle accidents or falls from higher than standing height.
5. Measurement of S1P
Fasting venous blood samples were centrifuged to obtain plasma. All samples showing hemolysis or clotting were discarded. All plasma samples were stored at −80°C before being assayed to determine the S1P concentration. S1P concentrations in 339 postmenopausal women were measured by a competitive enzyme-linked immunosorbent assay using kits from the Sejong Biomed Co., Ltd. (Paju, Korea) according to the manufacturer’s instructions.[23,24] Each plasma sample was assayed in duplicate, and the results for each plasma sample were reported as means. The lower limit of detection of the kits was 0.008 μmol/L, and the intra- and inter-assay CVs were 4.9% and 4.7%, respectively.
6. Statistical analysis
Data are presented as mean±standard deviation, median and interquartile range (IQR), or number (percentage), unless otherwise specified. The baseline characteristics of subjects with and without fractures were compared using the Student’s t-test for continuous variables and the χ2 test for categorical variables. Correlations were analyzed using Pearson’s correlation analysis with the Pearson correlation coefficient (r). Associations between S1P levels and fracture risk were investigated using univariate and multivariate logistic regression analyses after adjustments for CRFs of FRAX models (age, body mass index [BMI], previous fracture, parental history of hip fracture, current smoking, pre-menopause as a cause of secondary osteoporosis, and alcohol intake), FN-BMD, or TBS. Univariate and multivariate logistic regression analyses were performed to generate odds ratios (ORs) and the 95% confidence interval (CI) comparing the fracture risk according to tertiles based on plasma S1P concentrations, FRAX probabilities, or TBSs. AUC of the ROC curve analysis was performed to evaluate and compare the discriminatory performance for fracture of the S1P concentration, FRAX probability, and TBS alone and in combination. Finally, mediation analyses were conducted to test the hypothesis that additional factors mediated the relationship between the S1P level and fracture risk. The role of mediators in the relationship between the S1P level and fracture risk was evaluated by calculating the percentage of excess odds explained by the inclusion of the mediators in the model, which was calculated as (OR multivariate-adjusted model − OR multivariate-adjusted model+mediators)/(OR multivariate-adjusted model − 1)×100.[27] This percentage of excess odds described the degree to which a mediator explained the relationship between the S1P level and fracture risk. All statistical analyses were performed with SPSS Statistics software (SPSS Inc., Chicago, IL, USA). A P-value of less than 0.05 was considered statistically significant.
RESULTS
The characteristics of the study participants are listed in Table 1. The FRAX probability was higher in women with fractures than those without fractures (P<0.001). The TBS was lower in women with fractures than those without fractures (P<0.001). The plasma S1P concentration was significantly higher in women with fractures than in those without fractures (median, 3.26 μmol/L; IQR, 2.98–3.55 μmol/L vs. median, 2.70 μmol/L; IQR, 2.56–2.84 μmol/L; P=0.001).
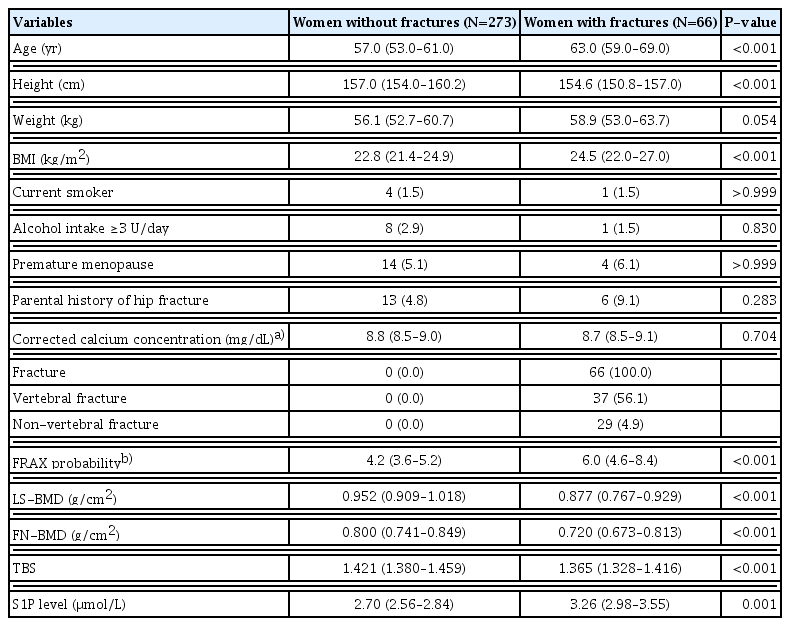
Baseline characteristics of the study participants (N=339)
The S1P concentration was positively correlated with age (r=0.129, P=0.019) and BMI (r=0.112, P=0.042). The S1P concentration was inversely correlated with FN-BMD (r=−0.146, P=0.008), but not LS-BMD (r=−0.085, P=0.123). The S1P concentration was positively correlated with the FRAX probability calculated from CRFs (r=0.091, P=0.049) and the FRAX probability calculated from CRFs and BMD (r=0.140, P=0.011). The S1P concentration was inversely correlated with the TBS (r=−0.096, P=0.049).
The subjects were divided into tertiles based on their plasma S1P concentrations, FRAX probabilities, and TBSs. Compared with the lowest S1P concentration tertile, the ORs for fracture in the middle and highest S1P concentration tertiles were 3.32 (95% CI,1.49–7.39) and 5.09 (95% CI, 2.22–11.67), respectively. Compared with the lowest S1P concentration tertile, the ORs for VF in the middle and highest S1P concentration tertiles were 5.00 (95% CI, 1.66–15.04) and 6.09 (95% CI, 1.96–18.91), respectively. Compared with the lowest S1P concentration tertile, the ORs for NVF in the middle and highest S1P concentration tertiles were 2.14 (95% CI, 0.71–6.45) and 4.76 (95% CI, 1.51–14.99), respectively.
Compared with the lowest FRAX probability tertile, the ORs for fracture in the middle and highest FRAX probability tertiles were 6.53 (95% CI, 2.17–19.63) and 14.59 (95% CI, 5.01–42.53), respectively. Compared with the highest TBS tertile, the ORs for fracture in the middle and lowest TBS tertiles were 1.55 (95% CI, 0.68–3.50) and 4.76 (95% CI, 2.28–9.93), respectively.
After additional adjustment for TBS tertiles (Table 2), subjects in the highest S1P concentration tertile (OR, 4.16; 95% CI, 1.76–9.82) had a higher fracture risk than those in the lowest S1P concentration tertile. After additional adjustment for FRAX probability tertiles (Table 3), subjects in the highest S1P concentration tertile (OR, 3.72; 95% CI, 1.56–8.84) had a higher fracture risk than those in the lowest S1P concentration tertile. After additional adjustment for tertiles of the FRAX probability and TBS as mediating variables in the multivariate-adjusted model, the OR of fracture in the highest S1P concentration tertile was 3.13 (95% CI, 1.28–7.66).
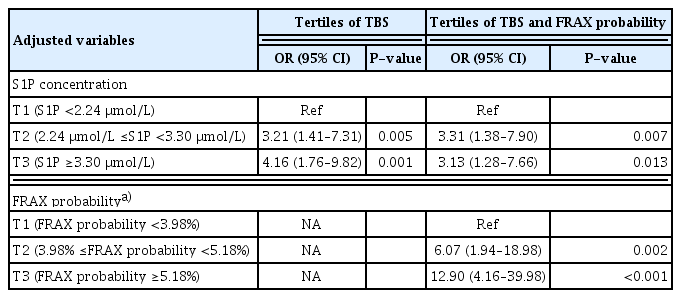

Multivariate logistic regression analyses of fracture according to tertile categories of the S1P concentration and TBS
The AUC of the S1P concentration was 0.596 (95% CI, 0.522– 0.671) with an optimal cut-off value of 1.48 μmol/L (data not shown). Upon addition of the highest S1P concentration tertile to the highest FRAX probability tertile (AUC, 0.668; 95% CI, 0.603–0.733), the AUC was significantly improved (AUC, 0.715; 95% CI, 0.644–0.786; P=0.013). Upon addition of the highest S1P concentration tertile to the lowest TBS tertile (AUC, 0.656; 95% CI, 0.590–0.722), the AUC was also significantly improved (AUC, 0.704; 95% CI, 0.634–0.774; P=0.013) (Fig. 1). Furthermore, upon addition of the highest S1P concentration tertile to a combination of the highest FRAX probability tertile and the lowest TBS tertile (AUC, 0.724; 95% CI, 0.658–0.791), the AUC was also significantly improved (AUC, 0.752; 95% CI, 0.687–0.817; P=0.040).
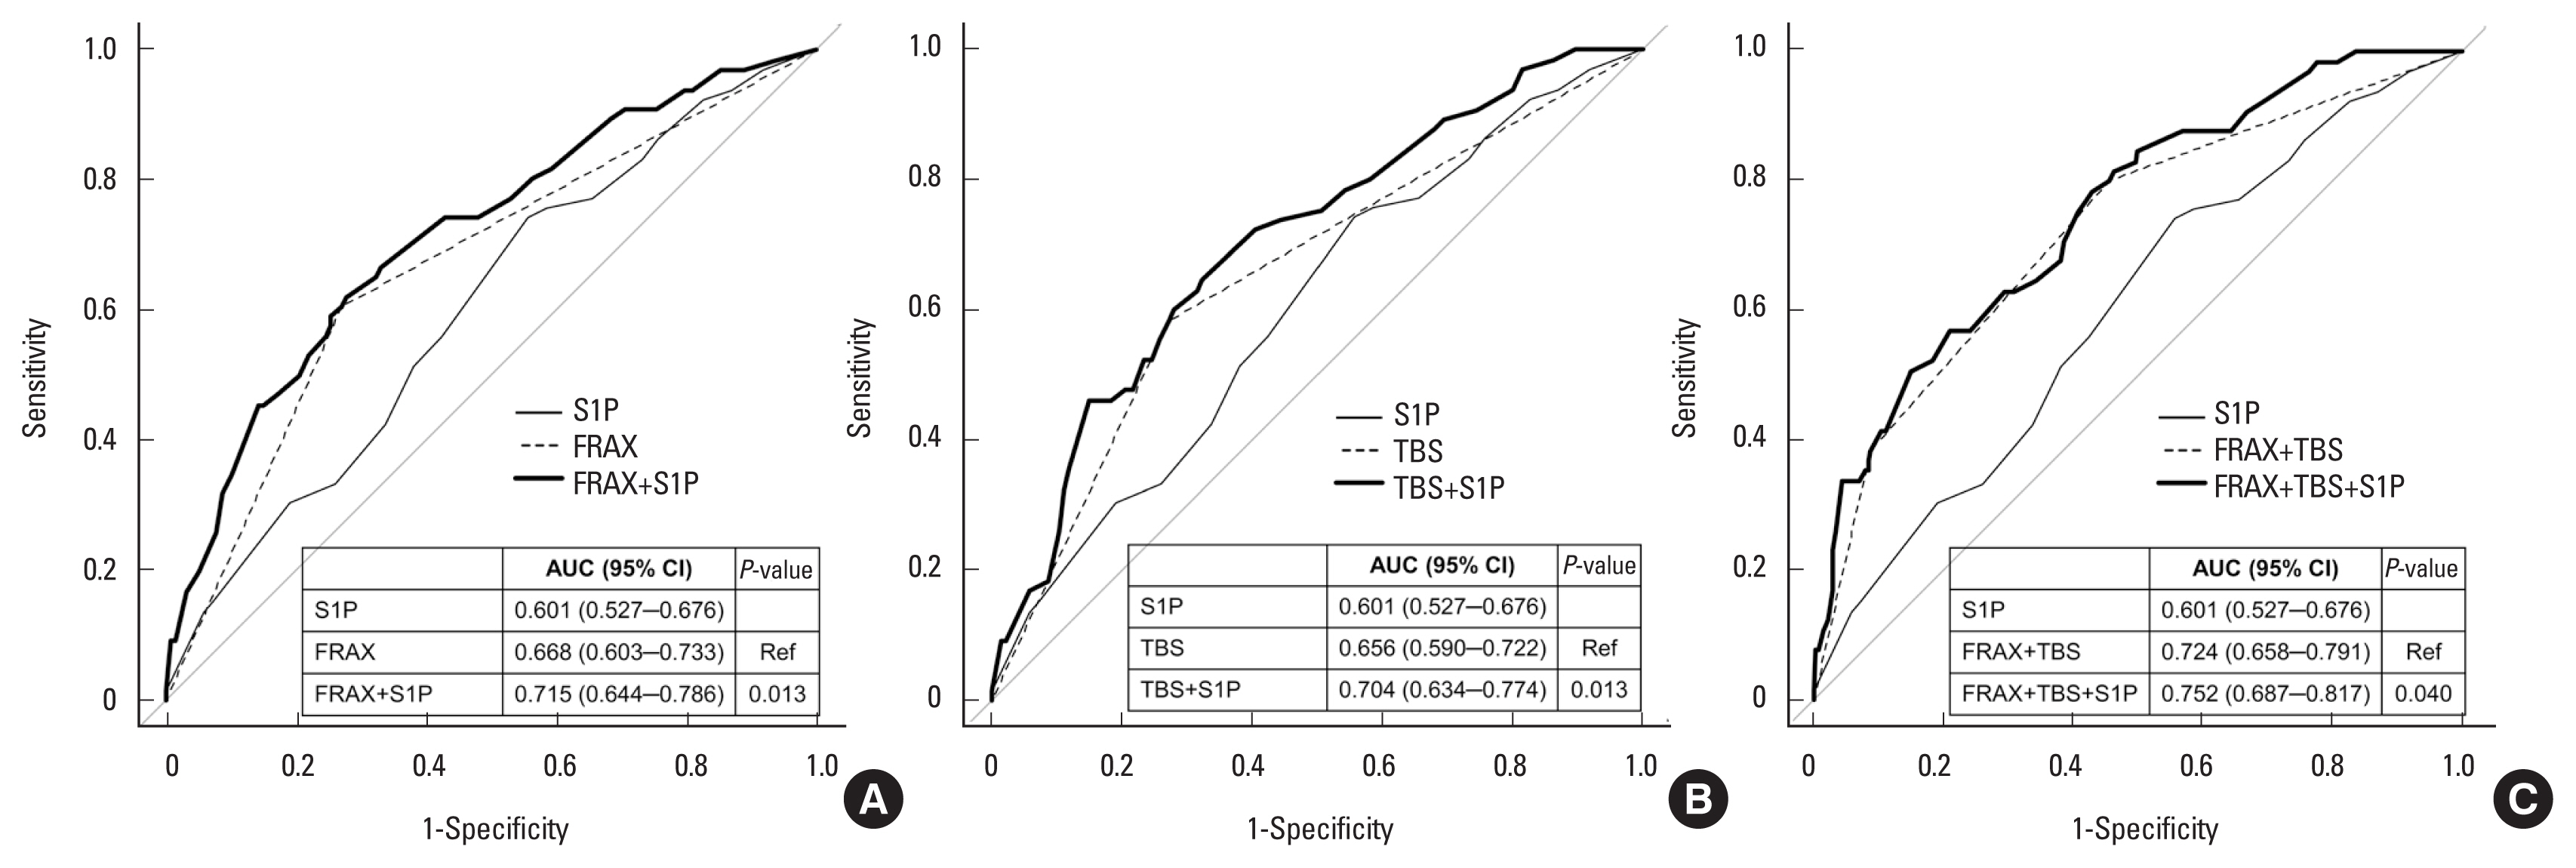
(A–C) Receiver operating characteristic curves of the S1P concentration, FRAX probability, and TBS alone and in combination for predicting osteoporotic fracture. FRAX model: the highest FRAX probability tertile (≥5.18%). S1P model: the highest S1P concentration tertile (≥3.30 μmol/L). TBS model: the lowest TBS tertile (<1.386). AUC, area under the receiver operating characteristic curve; S1P, sphingosine 1-phosphate; FRAX, fracture risk assessment tool; CI, confidence interval; TBS, trabecular bone score; Ref, reference.
Table 4 presents the results of analyses of the role of the FRAX probability and TBS as mediators of the relationship between the S1P concentration tertile and fracture risk. OR1 was the OR for the highest S1P concentration tertile in the multivariate-adjusted model. OR2 was the OR for the highest S1P concentration tertile after additional adjustment for the FRAX probability and TBS, mediating variables in the multivariate-adjusted model. The overall percentage reductions in the OR after adjustment for the FRAX probability and TBS were 32.6% and 21.7%, respectively.

Mediation analysis of the role of the FRAX probability and TBS in the relationship between the S1P concentration and osteoporotic fracture
DISCUSSION
To our knowledge, this is the first study to investigate the relationship between the circulating S1P level and fracture risk mediated by the FRAX probability and TBS. Subjects in the highest S1P concentration and FRAX probability tertiles had a significantly higher fracture risk than those in the lowest tertiles. Subjects in the lowest TBS tertile had a significantly higher fracture risk than those in the highest TBS tertile. The higher fracture risk for subjects in the highest S1P concentration tertile was retained after adjustment for the FRAX probability and/or TBS. Addition of the S1P concentration to the FRAX probability, the TBS, and a combination of the FRAX probability and TBS significantly improved the discriminatory performance for fracture. The FRAX probability and TBS accounted for 32.6% and 21.7%, respectively, of the relationship between the S1P level and fracture risk. To the best of our knowledge, these findings provide the first evidence that a high S1P level might correlate with the fracture risk through both the FRAX probability and TBS.
The present study showed that a higher FRAX probability was associated with fracture risk, independent of the TBS. The S1P level was positively associated with age, a FRAX variable. The inverse association of the S1P level with FN-BMD, a FRAX variable, is consistent with the results of previous studies.[19,20,22] These findings indicate the potential association of the S1P level with the FRAX probability. In the present study, the S1P level was positively associated with the FRAX probability for major osteoporotic fracture derived from CRFs with or without FN-BMD. Taken together, these findings suggested that S1P correlated with the fracture risk by affecting the FRAX probability. Mediation analysis showed that the FRAX probability partially explained the relationship between the S1P level and fracture risk by 32.6%.
The present study also showed that a lower TBS, which reflects deterioration of the bone microstructure, was associated with fracture risk, independent of the FRAX probability, consistent with the findings of previous studies.[8, 11,12] The inverse association of the S1P level with the TBS reported in the present study was also observed in a previous study.[24] This suggests that the S1P level reflects fracture risk through its association with the TBS. Finally, our mediation analysis indicated that the TBS accounted for 21.7% of the relationship between the S1P level and fracture risk.
Remarkably, our findings revealed that the circulating S1P level is significantly associated with fracture risk, independent of the FRAX probability and TBS. Our finding that the prediction ability was enhanced by addition of the S1P level to the FRAX probability is consistent with the results of a previous study.[23] To the best of our knowledge, the enhanced prediction ability by addition of the S1P level to the TBS and a combination of the FRAX probability and TBS was first reported. These findings indicate that factors other than the FRAX probability and TBS account for 45.7% of the relationship between the S1P level and fracture risk according to mediation analysis.
The fracture risk is determined by multiple risk factors other than BMD, CRFs, and deterioration of bone microarchitecture, including bone quality (bone geometry, micro-damage, mineralization, and bone turnover) and non-skeletal factors (fall), and their effects may be interactional.[3] Although we analyzed only the FRAX probability and TBS as factors that explain the association of the S1P level with fracture risk, other factors may exist. One example is increased bone resorption by S1P, leading to greater bone loss. Although in vivo studies showed that S1P may affect bone formation,[13,14,28] an in vitro study showed that S1P directly stimulates bone resorption by increasing osteoclast differentiation through increased receptor activation by the nuclear factor-κB ligand in osteoblasts.[18] Furthermore, in vivo studies showed that S1P indirectly stimulates bone resorption due to the migration of osteoclast precursors from blood (high concentration of S1P) to bone (low concentration of S1P) along a concentration gradient.[16,17] Consistent with the results of in vivo studies,[16,17] the S1P level is associated with bone resorption markers but not bone formation markers in humans.[19,20,22] Although we cannot explain these findings, the main effect of S1P on bone metabolism in humans seems to be on bone resorption rather than on bone formation. A higher circulating S1P level may also be associated with a higher fall risk. S1P affects the cellular biology of many tissues,[28,29] which can influence systemic fragility and lead to a higher fall risk. For example, S1P has been implicated in systemic inflammation,[30] which is associated with a higher fall risk.[31] The relationships between the circulating S1P level and factors other than BMD, CRFs, and deterioration of bone microarchitecture must be studied further.
This study has several potential limitations. First, the data were obtained from patients at a single medical center in Korea, which may have resulted in selection bias and may not be representative of the general population and all ethnicities. Thus, additional studies are needed to extend our findings to other populations of different ethnicities. Second, this was a cross-sectional case-control study, not a longitudinal study. Third, platelets and mast cells can secrete S1P when activated by thrombin and immunoglobulin E-bound antigen, respectively. Therefore, platelets and mast cells affect the S1P level. To minimize the effect of changes in the S1P level due to platelets and activated mast cells, we excluded subjects with a fever or an abnormal number of leukocytes or platelets in complete blood counts. In addition, it has been reported that neither platelets nor mast cells have a role in regulating the homeostatic levels of S1P in blood.[32] Fourth, we did not measure bone turnover markers. Fifth, there was no hip fracture among NVFs and we could not analyze the association of the S1P level with the subtypes of NVFs.
In conclusion, a higher S1P level can predict fracture risk by associating with the FRAX probability, bone microarchitecture, and other factors. Our findings suggest that addition of the circulating S1P level to the FRAX model and TBS, which are well-known predictors of fracture, can improve the prediction of fractures.
Notes
Funding
This study was funded by a National Research Foundation of Korea (NRF) grant funded by the Korean government (Ministry of Science and ICT) (No. 2022R1A2C1003661) and by the Korea Health Technology R&D Project, Ministry of Health & Welfare, Republic of Korea (Project No. HI15C2792). The sponsor had no role in the design of the study, in data collection, analysis, and interpretation, in the writing of the manuscript, or in the decision to submit the manuscript for publication.
Ethics approval and consent to participate
This study was approved by the AMC Ethics Review Committee, and written informed consent was obtained from all individual participants included in the study.
Conflict of interest
No potential conflict of interest relevant to this article was reported.