Bone Mineral Density, Trabecular Bone Score and Fractures in Patients Hospitalized for Heart Failure
Article information

Abstract
Background
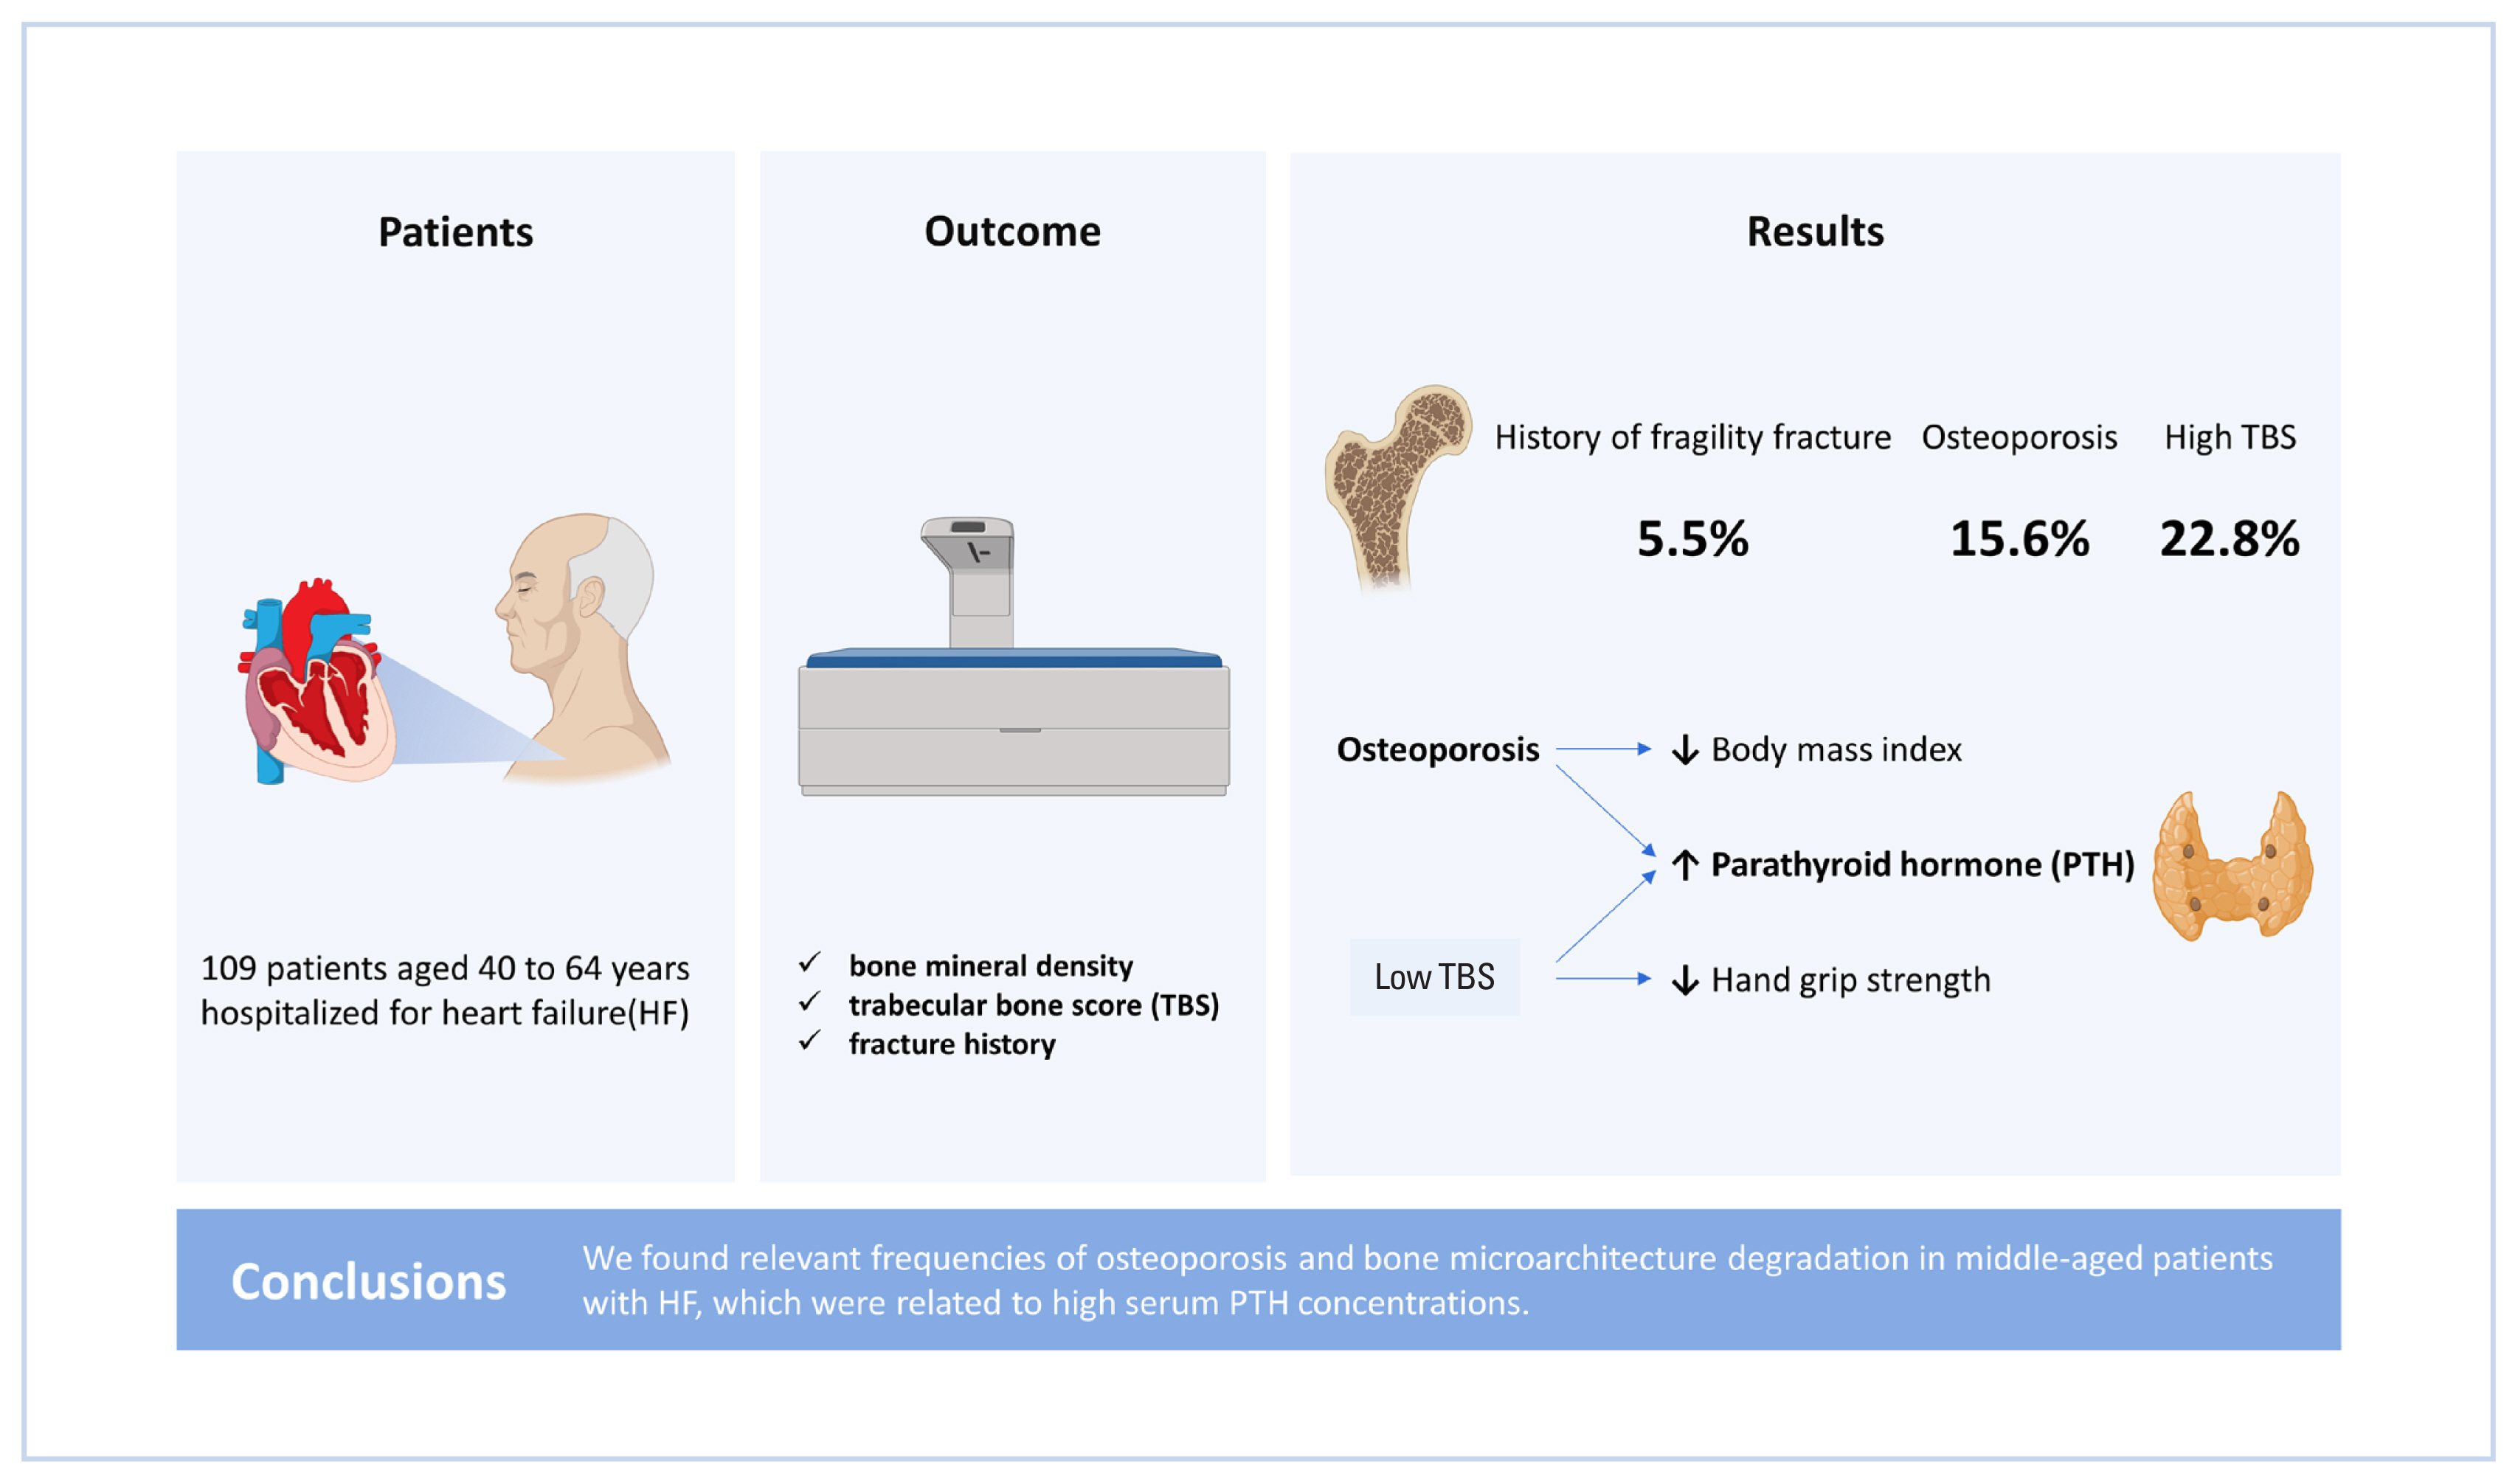
This study aimed to evaluate the bone mineral density (BMD), trabecular bone score (TBS), and fracture history of middle-aged patients hospitalized for heart failure (HF), as well as analyze the association of these factors with cardiometabolic parameters and muscle strength.
Methods
A cross-sectional study with patients aged 40 to 64 years hospitalized for HF was performed. Dual energy X-ray absorptiometry was performed to obtain BMD and TBS. Fracture history, handgrip strength (HGS), and clinical and laboratory cardiometabolic parameters of the patients were evaluated.
Results
Altogether, 109 patients were evaluated (female 50.5%). Medians and interquartile ranges for age and length of hospital stay were 58.0 (53.0–61.0) years and 20.0 (11.0–32.0) days, respectively. Osteoporosis was observed in 15.6% of the patients, low TBS was observed in 22.8%, and 6 patients had a history of fragile fracture. No differences between the sexes regarding BMD (P=0.335) or TBS (P=0.736) classifications were observed. No association was observed between low BMD and HF classification (P>0.05) regarding the ejection fraction, ischemic etiology, or New York Heart Association Functional Classification. However, there was a significant association between high serum parathyroid hormone (PTH) and the presence of osteoporosis (62.5 [37.2–119.0] pg/mL vs. 34.2 [25.0–54.1] pg/mL; P=0.016). There was a negative correlation between serum PTH and TBS (r=−0.329, P=0.038) and a higher frequency of reduced HGS in patients with low TBS (92.3% vs. 50.0%; P=0.009).
Conclusions
We found relevant frequencies of osteoporosis and bone microarchitecture degradation in middle-aged patients with HF, which were related to high serum PTH concentrations.
INTRODUCTION
Heart failure (HF) is a complex and heterogeneous clinical syndrome that is caused by structural or functional cardiac abnormalities, which culminate in impaired ventricular filling or blood ejection.[1,2]
Usually, HF is classified into 3 different categories according to the left ventricular ejection fraction (LVEF): HF with preserved ejection fraction (HFpEF) where LVEF is ≥50%, HF with mildly reduced ejection fraction (HFmrEF) where LVEF is 41% to 49%, and HF with reduced ejection fraction (HFrEF) where LVEF is ≤40%. From the perspective of symptoms, the New York Heart Association Functional Classification (NYHA-FC) is the most commonly used instrument for categorizing symptom severity.[1,2]
Osteoporosis and HF are associated with aging and are common causes of functional loss and prolonged hospital stays, thereby generating heavy burdens for the healthcare systems. Despite a dearth of data regarding the relationship between these 2 clinical conditions, certain indications have been reported regarding the association of HF with decreased bone mineral density (BMD), and consequently, a greater risk of fractures, with the participation of muscle mass and strength losses in this process.[3]
The measurement of areal BMD via dual energy X-ray absorptiometry (DXA) is the most established method for diagnosing osteoporosis; however, recently, methods that involve the evaluation of cancellous bone microarchitecture, such as trabecular bone score (TBS), has gained traction.[4–6] TBS is obtained with the help of software coupled with the DXA, which evaluates the pixel gray-level variations in the image of the lumbar spine and is a practical option that does not require exposure to radiation again.[5,6]
In this context, the present study aimed to evaluate the BMD, TBS, and fracture history of middle-aged patients hospitalized for HF and observe the frequencies of osteoporosis and bone microarchitecture degradation, as well as the association of these factors with the cardiometabolic parameters and muscle strength.
METHODS
This was a cross-sectional study conducted in the Cardiology and Endocrinology departments of a tertiary hospital located in Brazil, and the data collection was performed between June 2021 and February 2022, by consecutive sampling.
The study population comprised patients aged 40 to 64 years who were admitted due to HF in our hospital wards during the data collection period, agreed to participate in the research, and were previously diagnosed with HF (based on clinical and echocardiographic findings). Patients without a confirmed previous diagnosis of HF, with genetic disorders of bone metabolism or lipodystrophies, and physical or cognitive limitations that prevented them from providing essential data or being subjected to the required complementary exams were excluded from the study.
The categorical variables included sex, body mass index (BMI) classification, TBS classification (normal, >1.310; partial degradation of microarchitecture, 1.230–1.310; bone degradation, <1.230), [7] BMD classification (normal, T-score [TS] of femoral neck (FN), total femur [TF], and lumbar spine [LS] ≥−1.0; osteopenia, TS of at least one site between −1.0 and −2.5; osteoporosis, TS of at least one site ≤−2.5), [4] history of major osteoporotic fractures (spine, proximal humerus, hip, or forearm) that occurred spontaneously or in consequence of low-energy trauma, [8] glycemic status (diabetes, hemoglobin A1c [HbA1c] ≥6.5%; prediabetes, HbA1c 5.7%–6.4%; normoglycemia, HbA1c ≤5.6%), [9] chronic kidney disease (CKD; estimated glomerular filtration rate [eGFR] of <60 mL/min/1.73 m2, as calculated using the CKD-epidemiology collaboration [CKD-EPI] formula), [10] vitamin D deficiency (serum 25-hydroxy-vitamin D [25(OH)D] <20 ng/mL), [11] NYHA-FC (I–IV), LVEF classification (HFpEF, HFmrEF, and HFrEF), HF etiology (ischemic or non-ischemic, according to medical records), and handgrip strength (HGS) classification (low, <16 kg for women and <27 kg for men, according to the European consensus on sarcopenia).[12] The quantitative variables studied were age, length of hospital stay, TBS, HbA1c, eGFR calculated by the CKD-EPI, serum 25(OH)D levels, parathyroid hormone (PTH), LVEF, BMI, BMD (with TS of FN, TF, and LS), and HGS.
HGS was measured via a digital dynamometer (Instrutherm, São Paulo, Brazil), and the highest of 3 different measurements with the dominant hand was considered. BMD was assessed by DXA with a Lunar Prodigy Advance® densitometer (GE Healthcare, Madison WI, USA). TBS was calculated using the TBS InSight® software, version 2.1.0 (Medimaps Group, Geneva, Switzerland). Hormonal assessments were conducted via the Cobas E601 chemiluminescence analyzer (Roche Diagnostics, Basel, Switzerland).
1. Statistical analysis
Statistical analyses were performed using the SPSS software, version 21 (IBM Corp., Armonk, NY, USA).
Categorical variables were expressed as frequencies and compared using Pearson’s χ2 test (if <25% of the cells in the contingency tables had <5 individuals) or by Fisher’s exact test (if at least 25% of the cells had <5 individuals).
Quantitative variables were evaluated for normal distribution using Kolmogorov–Smirnov test. Those with normal distribution were expressed as mean and standard deviation and compared using Student’s t-test (parametric). The variables that did not conform to normal distribution were expressed as medians and interquartile ranges and compared using Mann–Whitney U test (non-parametric). Quantitative variables, in which different values were expected for men and women (BMD and HGS), were evaluated separately for each sex. Correlations between quantitative variables were also tested using Pearson’s linear correlation test (if both the variables were normally distributed) or Spearman’s correlation test (if at least one of the 2 variables was not normally distributed). For all tests, 95% confidence intervals were used, with statistical significance considered when P-value of less than 0.05.
2. Ethical considerations
This study had ethics committee approval, and all patients provided written informed consent.
RESULTS
Overall, 109 patients were evaluated, 55 (50.5%) of whom were female. Table 1 describes the general characteristics of the study patients and shows the comparison between the sexes.

General characteristics of the study patients and comparison between the sexes
The measures of the central tendency of the quantitative variables are shown in Table 2.
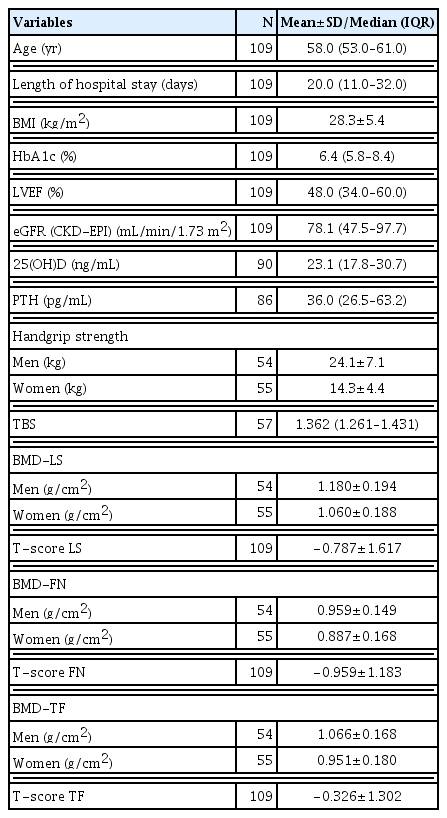
Quantitative data from middle-aged patients with heart failure
According to the densitometric data, 15.6% of the participants had osteoporosis, 39.4% had osteopenia, and 45.0% showed normal BMD (Table 1). Six patients (5.5%) had a history of major osteoporotic fracture (3 of each sex), of which 4 had osteopenia, as indicated by DXA, and 2 showed normal BMD (Fig. 1). Thus, taking into consideration the history of osteoporotic fractures together with the BMD, 21.1% of the patients had osteoporosis. None of the patients were using anti-osteoporotic therapy.

Data on the occurrence of major osteoporotic fractures in middle-aged patients with heart failure.
In females, the frequency of osteoporosis, as determined by BMD, and osteopenia were 16.4% and 45.5%, respectively. Among males, 14.8% had osteoporosis and 33.3% had osteopenia. There was no statistically significant difference in BMD classification between the sexes (P=0.335). TBS was obtained for 57 of the 109 patients, of whom 22.8% showed bone degradation and 14.0% showed partial degradation. Of the 57 patients whose TBS was calculated, no significant difference in its classification between the sexes was observed, with 17.4% of males presenting with bone degradation and 17.4% with partial degradation, while 26.5% of females presented with bone degradation and 11.8% with partial degradation (P=0.736) (Table 1).
No differences were observed between the groups with and without osteoporosis for HF classifications by NYHA-FC (P=0.142), LVEF (P=0.221), or etiology (P=0.131) (Table 3). Table 3 also demonstrates that there were no differences between the groups with and without osteoporosis regarding the glycemic status (P=0.130), frequency of CKD (P=0.608), vitamin D deficiency (P=0.742), low HGS (P= 0.251) or history of alcoholism (P=0.760) or smoking (P= 0.360).

Comparison of groups with and without osteoporosis regarding heart failure parameters, comorbidities, muscle strength, and habits
Likewise, there were no statistically significant differences between the groups with and without bone degradation indicated by TBS regarding NYHA-FC (P=0.172), LVEF classification (P=0.496), HF etiology (P=0.259), glycemic status (P=0.999), CKD (P=0.082), vitamin D deficiency (P= 0.449) or history of smoking (P=0.148) or alcoholism (P= 0.772). However, there was an association between low TBS and reduced HGS (P=0.009), as shown in Table 4.

Comparison of groups with and without degradation of bone microarchitecture regarding HF parameters, comorbidities, muscle strength, and habits
There was a significant association between the presence of osteoporosis with higher serum PTH (P=0.016), lower BMI (P<0.001) and lower TBS (P=0.013). Although the presence of bone degradation, as indicated by TBS, was not associated with BMI (P=0.443), it was related to higher serum PTH (P=0.024) and TS in the 3 bone sites that were evaluated. Length of hospital stay was not associated with osteoporosis P=0.247) or bone degradation (P=0.182) (Table 5).
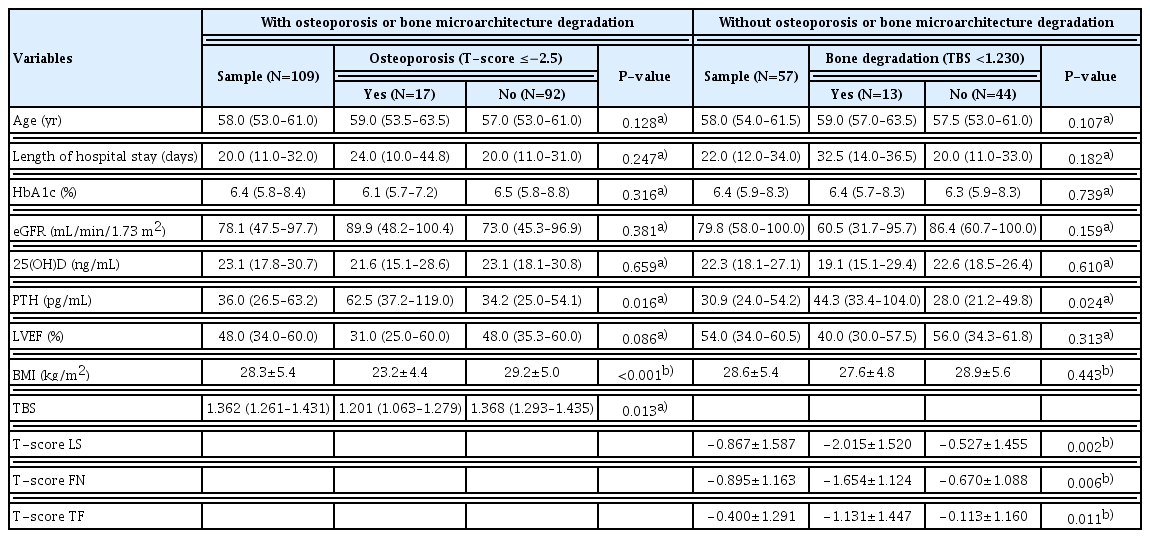
Differences between patients with or without osteoporosis or bone microarchitecture degradation
There was a statistically significant correlation between TBS and TS-LS (r=0.512, P<0.001), TS-FN (r=0.418, P=0.001), and TS-TF (r=0.386, P=0.003) and a negative correlation of TBS with PTH levels (r=−0.329, P=0.038). PTH did not significantly correlate with TS-LS (r=−0.129, P=0.236), but negatively correlated with TS-FN (r=−0.255, P=0.018), TS-TF (r=−0.254, P=0.018), 25(OH)D levels (r=−0.266, P=0.016), and eGFR (r=−0.420, P<0.001). No correlation of eGFR with TBS (r=0.232, P=0.083), TS-LS (r=−0.029, P=0.765), TS-FN (r=0.080, P=0.409), TS-TF (r=0.017, P=0.861), or 25(OH)D levels (r=0.061, P=0.569) was observed. The levels of 25 (OH)D did not show a correlation with TBS (r=0.117, P=0.442), TS-LS (r=0.141, P=0.184), TS-FN (r=0.131, P=0.217), and TS-TF (r=0.170, P=0.108). BMI did not show a correlation with TBS (r=0.078, P=0.562); however, it exhibited a correlation with TS-LS (r=0.301, P=0.001), TS-FN (r=0.295, P=0.002), and TS-TF (r=0.396, P<0.001). Figure 2 presents the main differences between the TBS and TS-LS correlations.
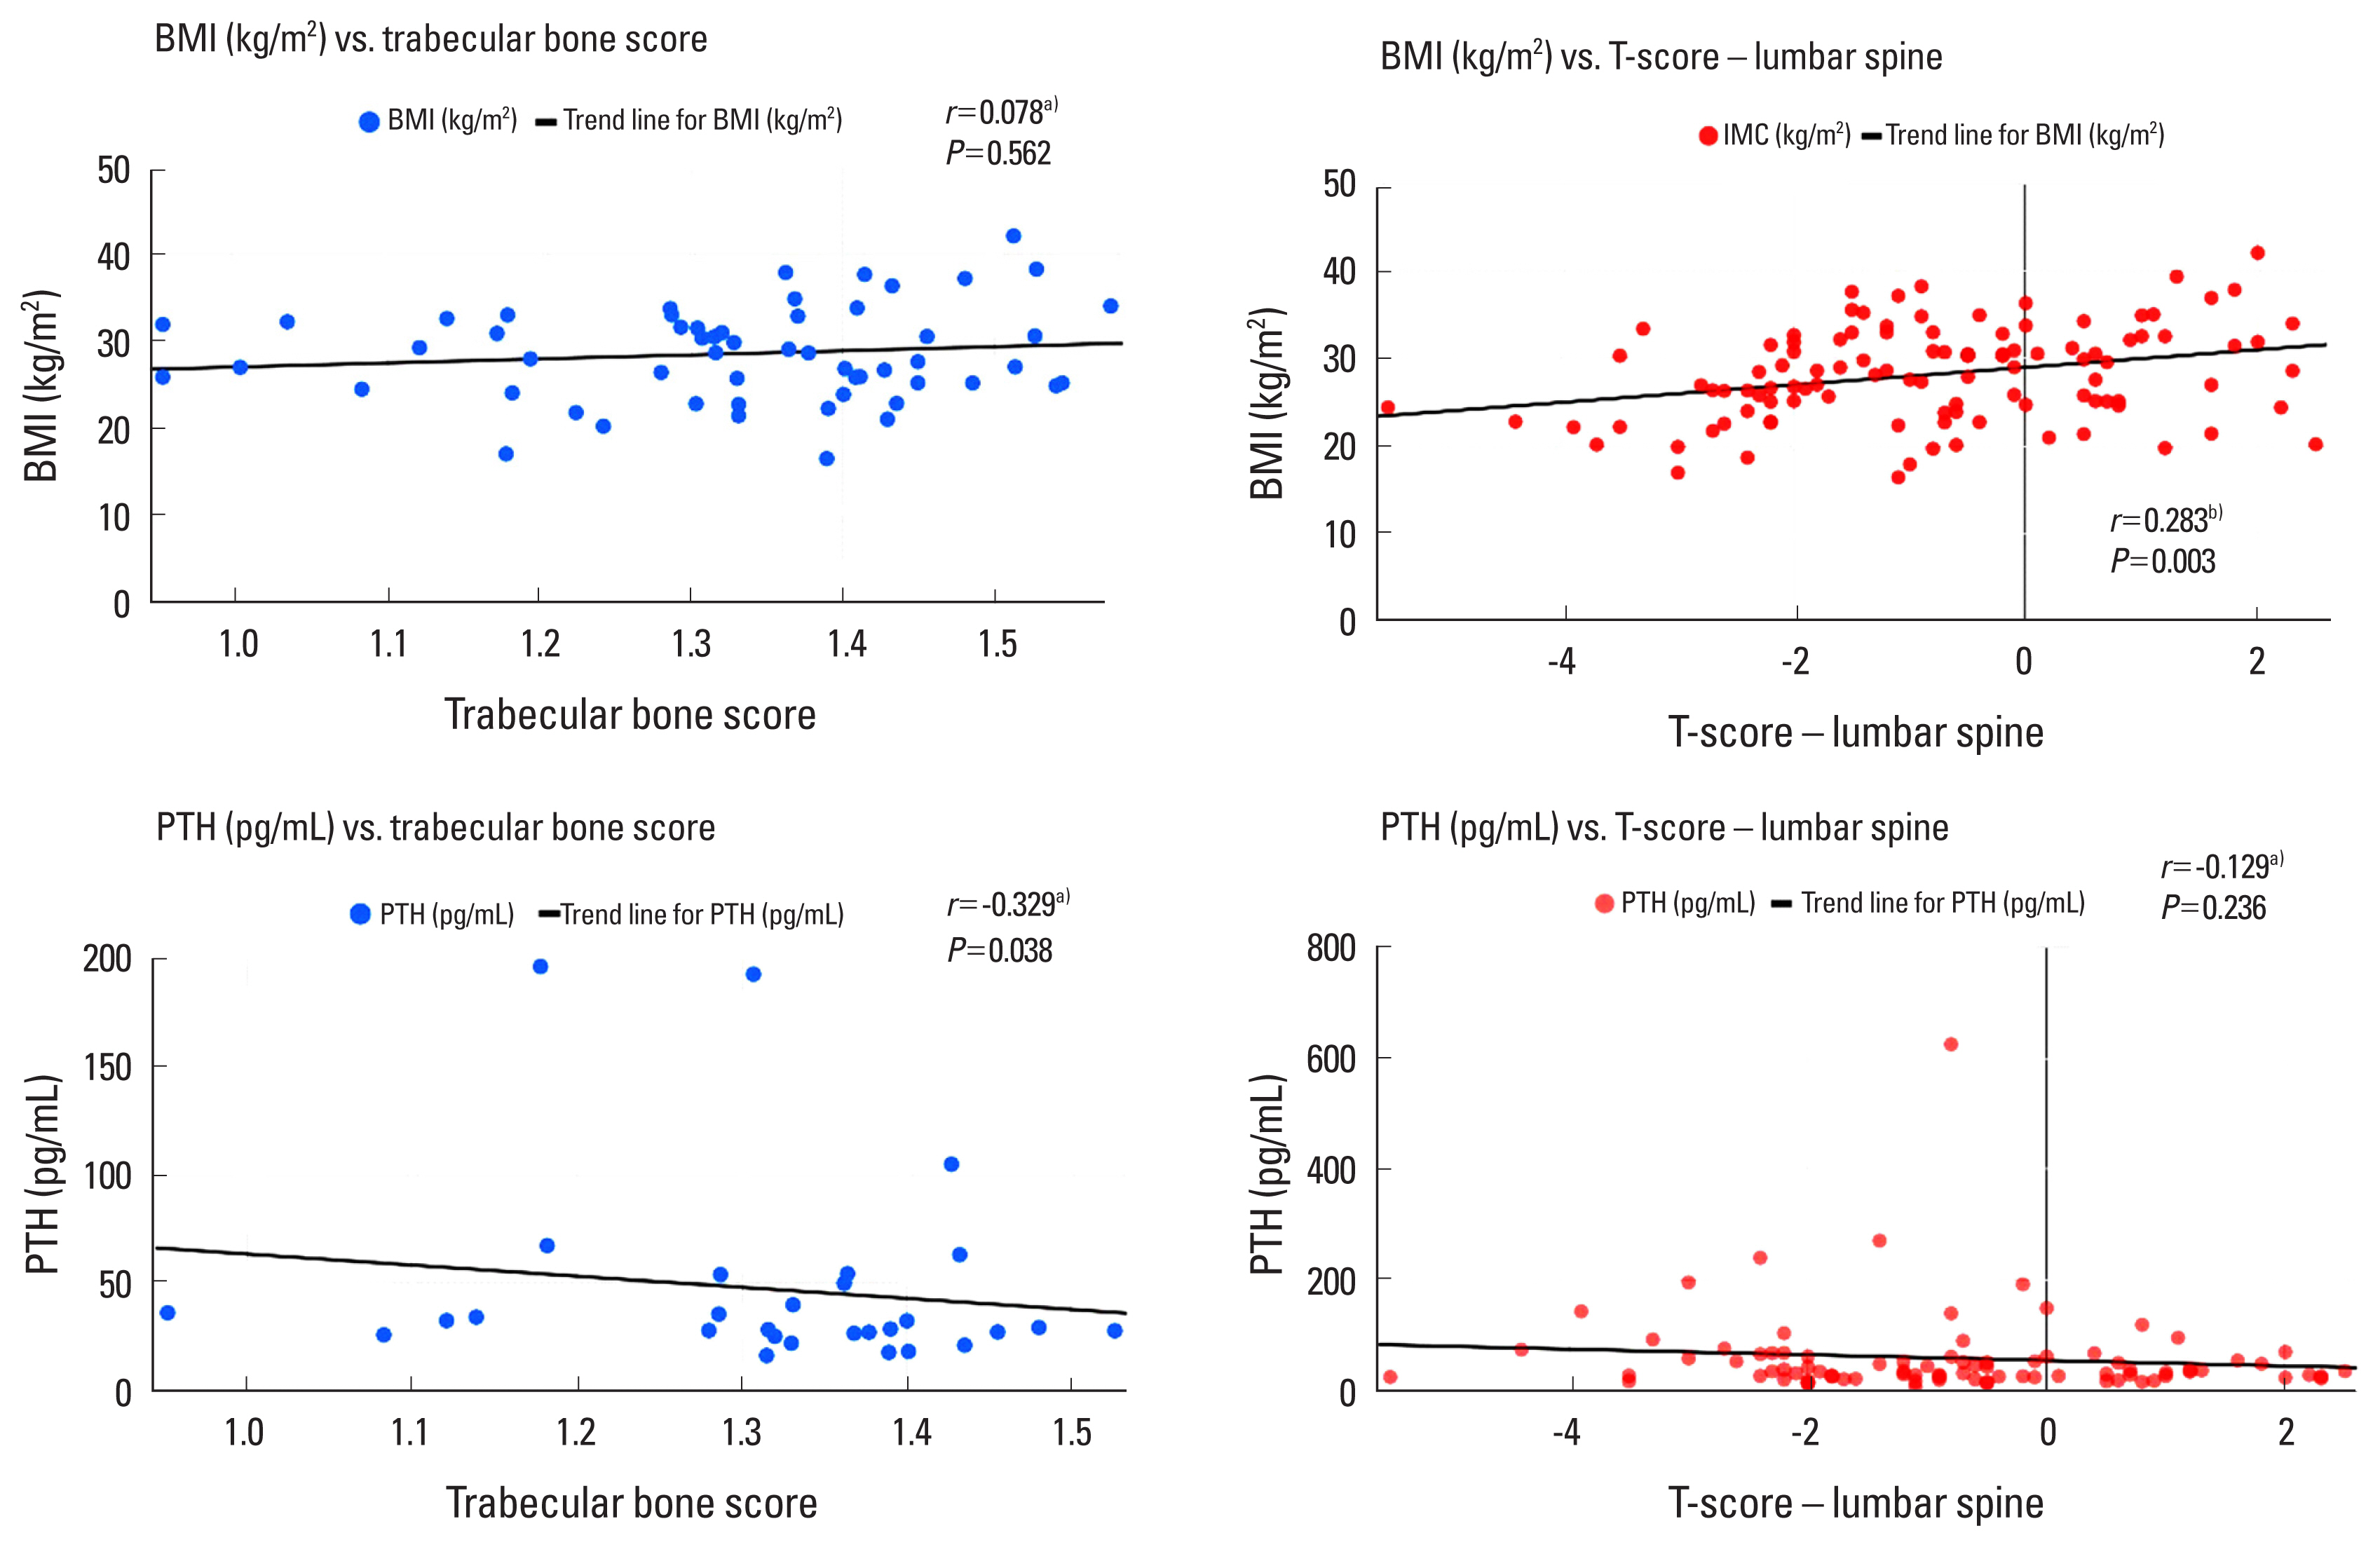
Differences between correlations observed for T-score of the lumbar spine and trabecular bone score. a)Spearman’s rank correlation coefficient. b)Pearson’s linear correlation test. BMI, body mass index; PTH, parathyroid hormone.
In males, an association was observed between low TBS and low FN-BMD (P=0.036); however, an association was not observed between bone degradation and LS-BMD (P= 0.156) (Table 6). Furthermore, an association between osteoporosis and low HGS means was observed (19.1±6.8 kg versus 25.0±6.9 kg; P=0.032). In females, an association was observed between bone degradation and low LS-BMD (P=0.042); however, no association was observed between bone degradation and FN-BMD (P=0.109) (Table 6). Low HGS was associated with bone degradation (P=0.002), but not with osteoporosis (13.1±3.7 kg vs. 14.6±4.6 kg; P=0.363).

Differences in BMD and muscle strength according to bone microarchitecture degradation and sex
DISCUSSION
This cross-sectional study investigated changes in areal BMD and bone microarchitecture, as well as fracture history, in middle-aged patients hospitalized for decompensated HF. Our results showed an association between higher serum PTH and the presence of osteoporosis and bone degradation indicated by TBS, with low BMI being associated with osteoporosis but not with low TBS, while muscle strength was associated with bone degradation but not with osteoporosis.
In this study, a relevant history of clinical fractures was found in middle-aged patients with HF. None of the patients with a history of fracture had osteoporosis by BMD, and one-third of them had normal bone mass. Although BMD is considered the best predictor of osteoporotic fracture in clinical practice, most fragility fractures occur in individuals with osteopenia, and it is recommended that fracture risk assessment combines BMD with other risk factors for these events.[5,13] We also found comparable rates of osteoporosis and fractures in males and females, which contrasts with the higher prevalence of these findings in women in the general population.[14,15] Previous studies have reported an association of HF with a higher risk of major osteoporotic fractures, increasing these events by 30%, independently of BMD and other traditional risk factors.[16] These data indicate HF to be a potential cause of bone impairment in middle-aged individuals, seemingly capable of equalizing the rates of bone loss and fractures between the sexes.
Several mechanisms can explain the skeletal consequences of HF. Tissue hypoxia promotes osteoclastic activity.[17–19] The hyperactivation of the renin–angiotensin–aldosterone system, a key mechanism in the pathophysiology of HF, increases calcium and magnesium excretion and oxidative stress, which contribute to the elevation of PTH levels and the consequent potentiation of bone resorption.[1,2, 20,21] Functional limitations and immobility caused by HF also generate bone loss.[3,22,23] Furthermore, CKD and vitamin D deficiency, which are major causes of secondary hyperparathyroidism, are often present in a multimorbid context with HF, [24,25] as observed in our study, wherein each morbidity affected more than one-third of the evaluated individuals. In the present study, serum PTH and 25 (OH)D levels as well as serum PTH and eGFR were negatively correlated, which reinforces the importance of secondary hyperparathyroidism as a cause of bone impairment in HF.
It is uncommon for middle-aged individuals to comprise the study population of epidemiological studies evaluating the association between osteoporosis and HF. Another study was identified that evaluated bone health in patients with HF specifically in this age group, which found an association between high PTH levels and the incidence of vertebral fractures.[26] In our study, an association was found between osteoporosis, BMD, and high serum PTH. Thus, PTH can be considered a potential biomarker of bone mass loss and fracture risk in middle-aged individuals with HF.
In the present study, BMI and BMD were positively correlated; however, no correlation was found between BMI and TBS. In the absence of HF, high BMI may interfere with the accuracy of TBS.[27–30] However, to our knowledge, no previous studies have evaluated the correlation between TBS and BMI in individuals with HF. Therefore, despite the small number of patients undergoing this method, our study demonstrated TBS to be an important tool in assessing bone health in individuals with HF without major interference that may be attributable to BMI. Furthermore, the negative correlation observed between PTH levels and TBS, but not between PTH levels and TS-LS, reinforces the idea that TBS can provide additional information on bone health in HF. Although higher BMI is associated with high BMD, it remains crucial to explore body composition, especially since lean, mineral-free mass has been shown to be the main component of soft tissues associated with higher BMD.[31]
In a study with older women, an association was found between LVEF and BMD, suggesting that impaired ventricular function contributes to osteoporosis development.[32] In the present study, although no statistically significant association was found, a trend toward lower LVEF values in the participants with osteoporosis was observed. Regarding HF symptoms, one study in elderly patients found that NYHA-FC was associated with bone loss, [33] contrasting with our findings in non-elderly individuals.
Regarding muscle strength, an Asian study evaluated HGS in women and men above the age of 50 years. They found low HGS to be associated with low BMD in multiple sites and bone degradation, as indicated by TBS.[34] In the present study, an association was observed between low HGS and bone degradation but not between low HGS and osteoporosis. To the best of our knowledge, there were no previous studies that evaluated these associations in individuals with HF. Furthermore, we found an association between bone microarchitecture degradation in males and low FN-BMD, but not LS-BMD, while the opposite was observed in females. This indicates the potential of muscle strength, bone mass, and microarchitecture to have specific characteristics in the middle-aged population with HF, which is different from that of the general population.
The main limitations of this study are associated with its design, the absence of a control group, the absence of a tool to actively search for fractures, and possibly the sample size. Moreover, reverse causality bias, inherent to cross-sectional studies, must be considered, especially due to the overlapping risk factors and pathophysiological mechanisms between HF and musculoskeletal impairments. The absence of normal distribution for most of the quantitative variables made it impossible to adequately fulfill the assumptions for performing multivariate analysis, which would provide results that are less influenced by potential confounding factors. The use of an imaging method that allows the investigation of morphometric fractures could demonstrate a higher prevalence of this bone outcome, as we only evaluated the history of previous osteoporotic fractures. The sample size was obtained by non-probability sampling during the proposed data collection period of 9 months and may have contributed to the absence of normal distribution in some variables. The absence of a control group does not allow us to determine the effect of HF on bone metabolism. The strength of our study lies in the scarcity of studies evaluating bone health, including bone microarchitecture, in non-elderly patients hospitalized with HF and its associated factors.
In conclusion, we found relevant frequencies of osteoporosis and bone microarchitectural degradation in middle-aged patients with HF, which were related to high serum PTH concentrations. The presence of bone degradation indicated by TBS proved to be a useful tool, as unlike BMD, it did not suffer interference from BMI and was associated with low muscle strength.
Acknowledgments
The authors would like to thank the Endocrinology and Cardiology divisions of the Institution for making the research possible.
Notes
Ethics approval and consent to participate
This study conformed to the ethical guidelines of the 1975 Declaration of Helsinki and all patients provided written informed consent prior to enrollment.
Conflict of interest
No potential conflict of interest relevant to this article was reported.