

Skip to main navigation Skip to main content
  • KSBMR

JBM : Journal of Bone Metabolism

OPEN ACCESS
ABOUT
BROWSE ARTICLES
EDITORIAL POLICIES
FOR CONTRIBUTORS

Articles

Original Article

Different Pattern of T-Score Discordance between Patients with Atypical Femoral Fracture and Femur Neck Fracture

Journal of Bone Metabolism 2023;30(1):87-92.
Published online: February 28, 2023

1Department of Orthopedic Surgery, Ewha Womans University, College of Medicine, Mokdong Hospital, Seoul, Korea

2Department of Orthopedic Surgery, Ewha Womans University, College of Medicine, Seoul Hospital, Seoul, Korea

Corresponding author: Young Do Koh, Department of Orthopedic Surgery, Ewha Womans University, College of Medicine, Mokdong Hospital, 1071 Anyangcheon-ro, Yangcheon-gu, Seoul 07985, Korea, Tel: +82-2-2650-5890, Fax: +82-2-2642-0349, E-mail: ydkoh@ewha.ac.kr
• Received: January 5, 2023   • Revised: January 26, 2023   • Accepted: February 3, 2023

Copyright © 2023 The Korean Society for Bone and Mineral Research

This is an Open Access article distributed under the terms of the Creative Commons Attribution Non-Commercial License (https://creativecommons.org/licenses/by-nc/4.0/) which permits unrestricted non-commercial use, distribution, and reproduction in any medium, provided the original work is properly cited.

  • 5,023 Views
  • 80 Download
  • 3 Crossref
  • 2 Scopus
prev next
  • Background
    Our study evaluated the prevalence and pattern of T-score discordance between the spine and hip in Korean patients with atypical femoral fracture (AFF) and femur neck fracture (FNF).
  • Methods
    A total of 49 patients (all women) who were treated for AFF and 1:3 matched 147 female patients with FNF were included from January 2012 to August 2022. A discordance of more than 1.5 between lumbar spine and femur neck bone mineral density (BMD) was defined as a difference and divided into 3 groups: lumbar low (LL; lumbar BMD is less than femur neck BMD), no discordance (ND), and femur neck low (FL; femur neck BMD is less than lumbar BMD). We compared the prevalence and pattern of discordance between 2 groups, and the associated risk factors of T-score discordance among the subjects were evaluated using regression analysis.
  • Results
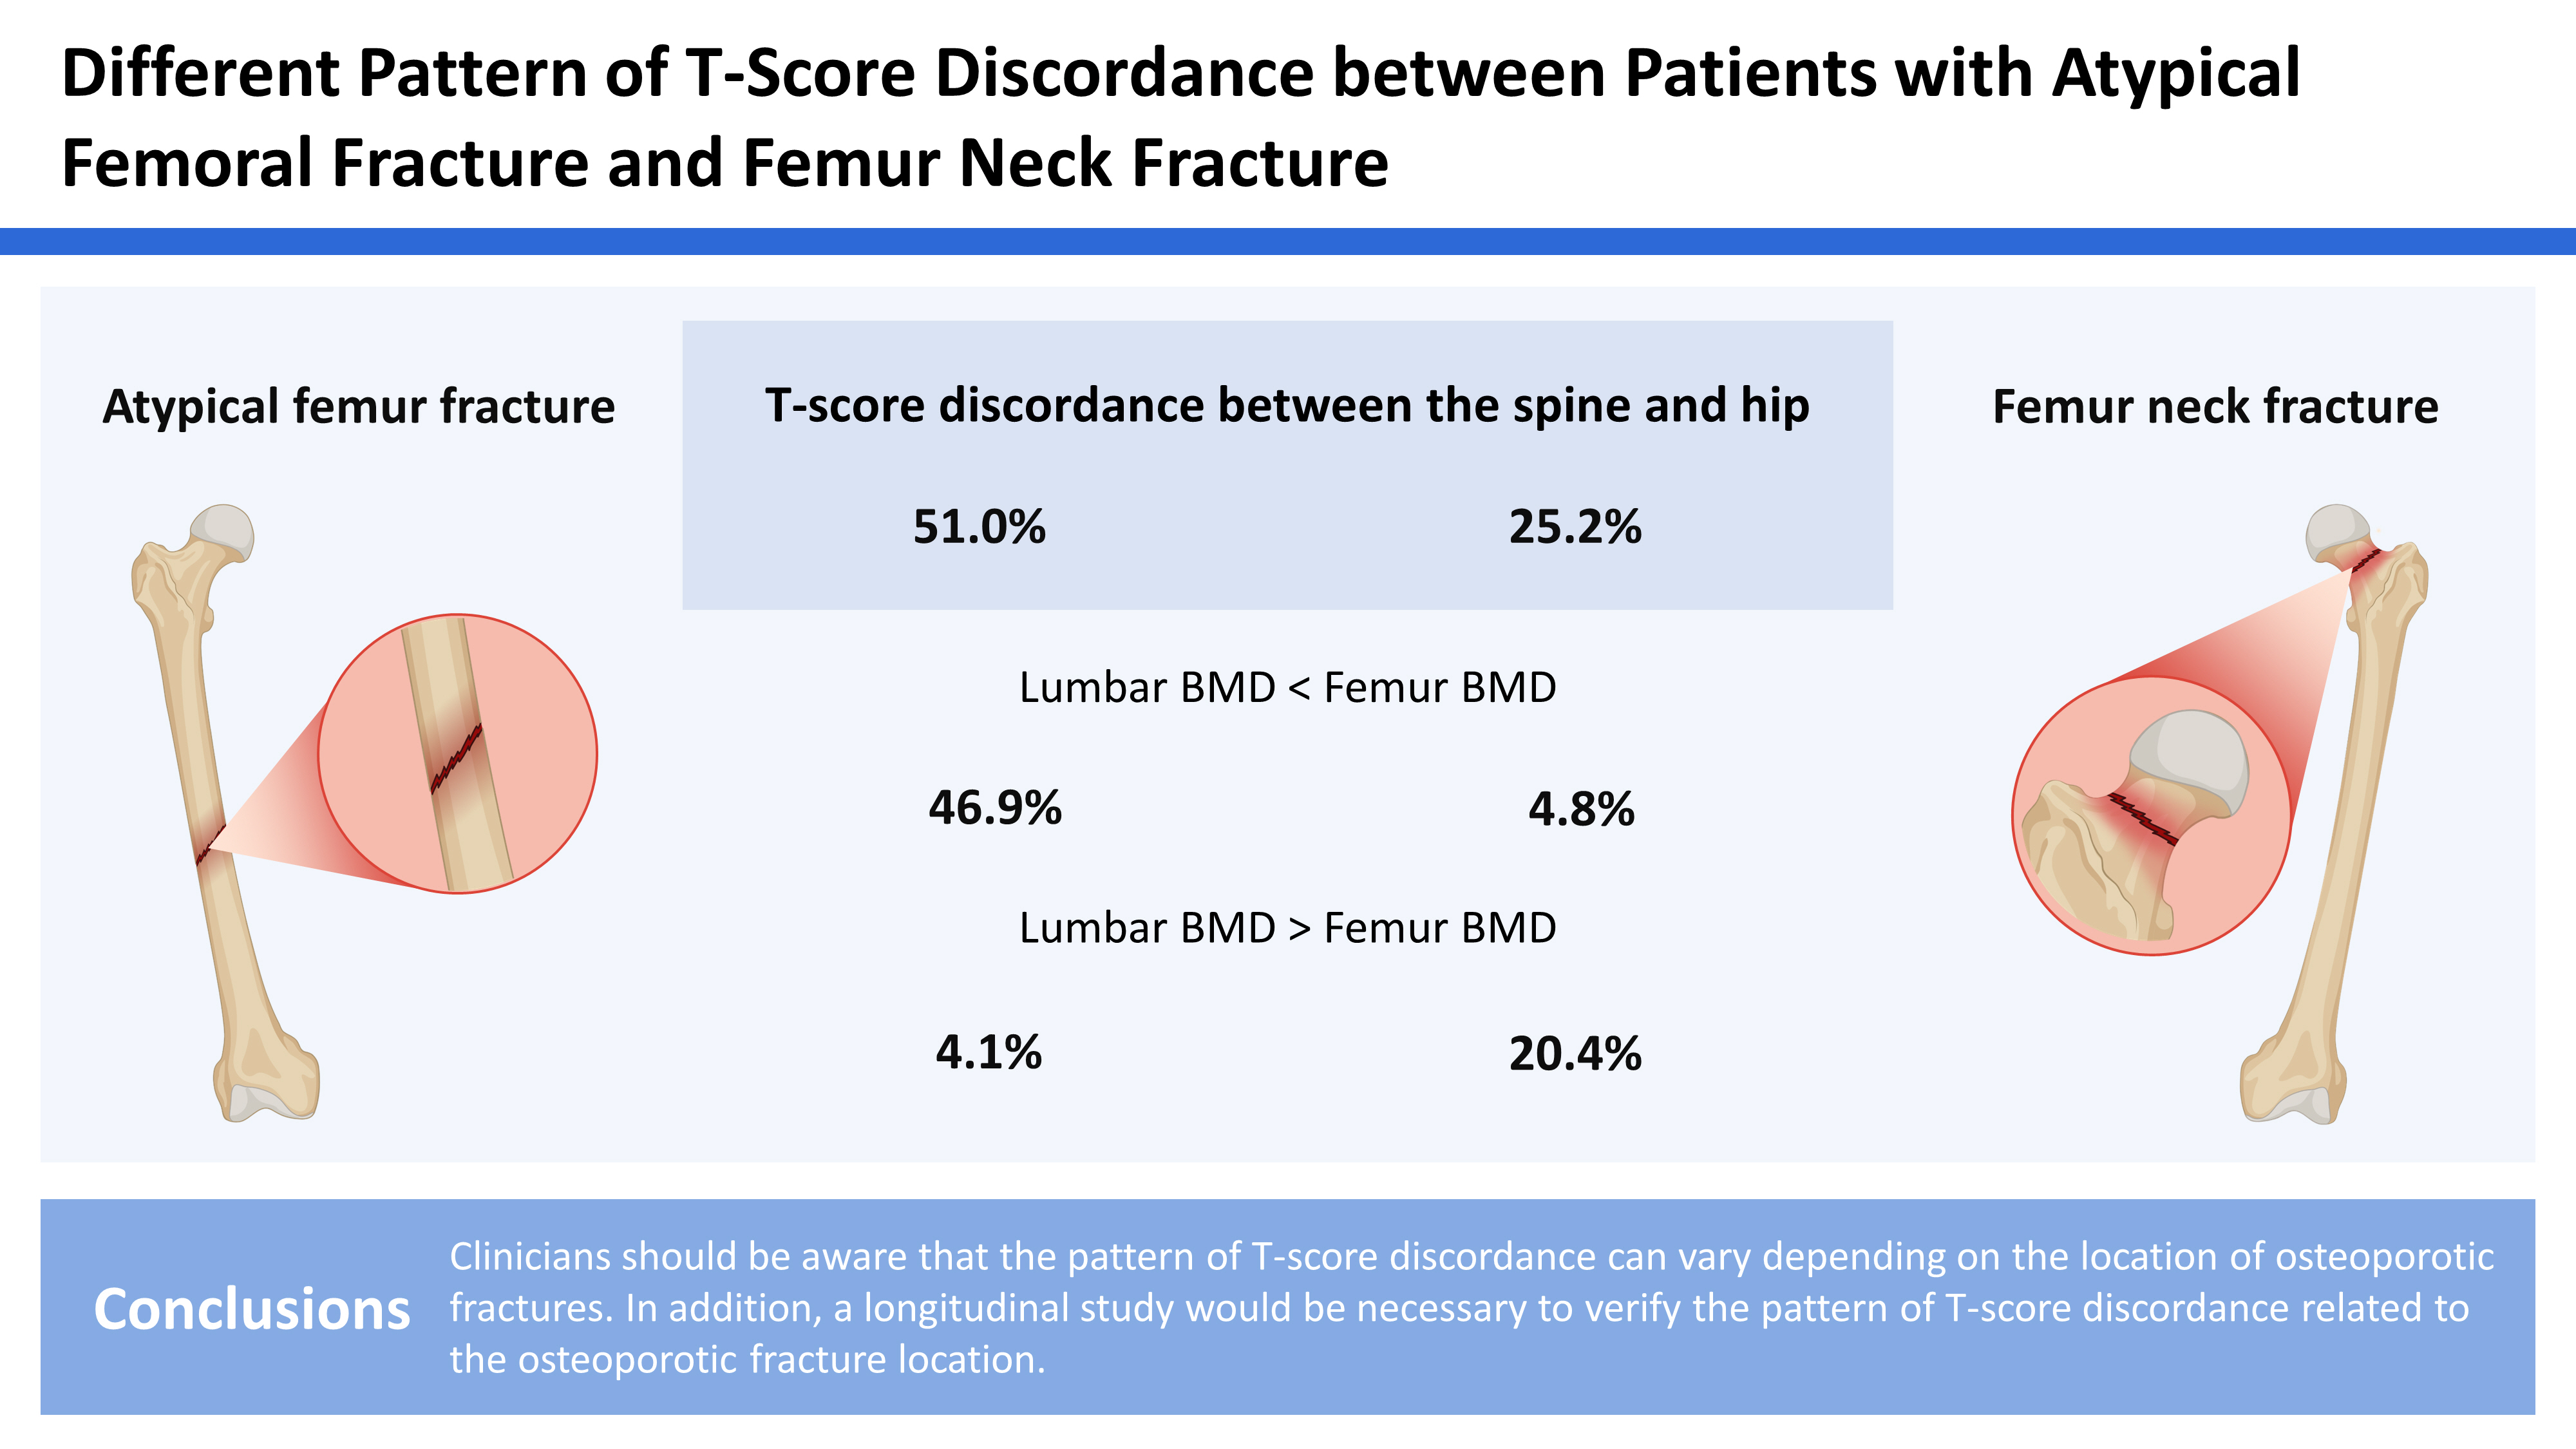
    The prevalence of discordance was significantly higher in patients with AFF (51%) than in those with FNF (25.2%; P<0.001). LL discordance was found in 46.9% of the patients with AFF but only 4.8% in those with FNF. Conversely, FL discordance was found in 4.1% of the patients with AFF and 20.4% in those with FNF, respectively. No specific risk factor was found as T-score discordance in the 2 groups.
  • Conclusions
    Clinicians should be aware that the pattern of T-score discordance can vary depending on the location of osteoporotic fractures. In addition, a longitudinal study would be necessary to verify the pattern of T-score discordance related to the osteoporotic fracture location.
Osteoporotic hip fractures in the elderly usually need surgical treatment to decrease morbidity and mortality.[1] Also, it is essential to manage osteoporosis after surgery of hip fracture to prevent a second osteoporotic fracture and dual energy X-ray absorptiometry (DXA) is a standard tool to evaluate bone mineral density (BMD).[2] However, clinicians commonly observe the discordance in T-score at the 2 different skeletal sites (lumbar spine and hip) known to increase fracture risk.[3,4] Spine-hip discordance (SHD) can be categorized into lumbar low (LL) discordance (lumbar BMD is lower than femur neck BMD), no discordance (ND) and femur neck low (FL) discordance (femur neck BMD is lower than lumbar BMD).[5,6]
Recently, several studies investigated the prevalence and impact of SHD on the management of osteoporosis. One comparative study revealed that the prevalence of LL discordance was significantly higher in atypical femoral fractures (AFF) patients than in the Korean osteoporosis population (63.5% vs. 31.7%).[7] Another study also has shown that patients with AFF have a significantly higher prevalence of LL discordance than elderly patients who were treated with intertrochanteric fractures.[8] However, a large cohort study of 1,090 fragility hip fractures showed higher rates of FL discordance compared to the general population.[9] Thus it seems to be there are differences in pattern of discordance according to the fracture site or type.[10]
Studies on the prevalence and factors of T-score discordance in Korea are still lacking, and no studies have examined discordance of AFFs when compared with patients who were treated with osteoporotic femur neck fracture (FNF). The aim of current study is to compare the prevalence and risk factors of SHD between patients with AFF and FNF from a single tertiary orthopedic institution.
1. Included patients
We carried out a retrospective review of patients diagnosed with femur shaft and sub-trochanter fractures under the official approval of the Institutional Review Board (EUMC 2022-10-020). From January 2012 to August 2021, we identified 292 patients treated with femur shaft or sub-trochanter fractures. We excluded patients treated with comminuted fracture (N=211) or supra-condylar femoral fracture (N=7).
AFF was defined as met at least 4 of the 5 major criteria of 2014 The American Society for Bone and Mineral Research definition.[11,12] The AFF was properly treated based on current treatment principles with intramedullary nailing. After reviewing X-ray, 8 patients who had pathologic (metastatic) fractures and 11 patients without DXA were excluded, and 49 patients were finalized.
There were 40 femur shaft fractures (81.6%), 9 femur subtrochanteric fractures (18.4%). All were female and 46 patients (93.9%) had been treated with osteoporosis treatment. The average age at the time of fracture was 76.9 years (range, 61–92 years) and other demographic data are presented in Table 1.
The comparative group was selected from the pool of patients from 630 consecutive patients who had been treated with FNF. Confounding factors included age, sex, body mass index (BMI) and Charlson Comorbidity Index (CCI). Based on these variables, 1:3 propensity score matching patient match was done using propensity scores estimated on the scale of the log odds under a logistic regression mode.
2. BMD measurement and T-score discordance
Bone density measurements were performed on the proximal femur proximal part of the femur (neck and total hip) and lumbar spine using a Lunar Prodigy scanner (Lunar Corp., Madison, WI, USA) Mean lumbar spine areal BMD values were used from at least 2 evaluable vertebrae from L1 to L4, and if there was a focal structural defect or a discrepancy of >1 standard deviation (SD) in T-score between adjacent vertebrae, the physicians excluded that vertebral level. The femoral neck and total hip T-scores were measured in unfractured femur, and the lowest score at either site was used as the femoral T-score for the analysis. All densitometry was performed within 1 month after fracture occurrence. The difference in the discordance between L1–4 and femur neck BMD was defined as ≥1.5 SD, and was divided into 3 groups: LL, ND, and FL groups.[13]
3. Outcome variables
We evaluated the prevalence and compared the type of T-score discordance between patients with AFFs and FNFs. To determine associated risk factors for T-score discordance, we first investigated demographic differences between the concordance and discordance groups and assessed medical conditions affecting osteoporosis including age, BMI, BMD, CCI, and previous history of osteoporotic treatment.
4. Statistical analysis
According to the normal distribution, Student’s t-tests or Mann-Whitney U test was used to compare continuous data, and the χ2 test or Fisher’s exact test was used to analyze categorical data. For all other tests, a 2-sided P-value of 0.05 was considered significant. To determine the risk factors of discordance, multivariable regression analysis was performed in variables with a P-value less than 0.1. Statistical analyses were conducted with the SPSS for Windows statistical package, version 16.0 (SPSS Inc., Chicago, IL, USA). The level of significance was set at P less than 0.05.
According to the World Health Organization classification, there were 41 patients (83.7%) with osteoporosis, 6 (12.2%) with osteopenia, and 1 (2%) with a T-score in the normal range in the AFF patients. In all cases, T-score discordance found in 25 out of 49 cases was 51%. Among them, there was a LL discordance in 23 cases (46.9%), and 2 patients (4.1%) had FL discordance.
The prevalence of osteoporosis among 147 FNF patients were 81.0% (119 patients) and other 28 patients were diagnosed with osteopenia. Discordance was found in 37 patients (25.2%) with FNF, so significantly lower than those with AFF (P<0.001). Among them, there was a LL discordance in 7 cases (4.8%), and 30 patients (20.4%) had low FN discordance (Table 1).
Previous history of osteoporosis treatment, weight, height, BMI, and CCI did not differ between the concordance and discordance groups (Table 2). However, BMD T-score did differ significantly between these groups. Multivariable analysis was not able due to statistical significance.
Our study shows that the pattern of T-score discordance is obviously different according to the hip fracture type even co-variants including their age were matched. The incidences and patterns of SHD are known to be different according to their age.[1416] Because different bone turnover rate of cortical and cancellous bones plays a major role in SHD in middle-aged women, but various degenerative changes such as osteoarthritic spurs, and calcification of aorta are associated in older age (>70 years).[6,17,18]
SHD is an upcoming issue because it is known to increase osteoporotic fracture risk. One previous study of 1,090 hip fractures showed ND itself, but the FL discordance type may be a strong risk factor for hip fracture which needs further treatment.[9] Otherwise, our previous study showed that LS discordance was main pattern (81.3%) in patients with an osteoporotic vertebral compression fracture.[10] It is notable because T-score of the spine is usually higher than that of the hip in the elderly over 70 years of age due to degenerative changes.[15,19] Considering the above results, clinicians need to know the possibility of discordance and type to predict osteoporotic fracture.[20]
We usually follow-up BMD using DXA, but only BMD not discordance was considered to predict major osteoporotic fracture. Only T-score was focused, but the combination of these 2 skeletal regions (lumbar spine and femur) also be an important factor when we follow up with patients.[21] It might be the improvement of BMD is not the same between the anatomic regions as the rates of bone loss also differ substantially in the same individual.[22]
From multicenter prospective study revealed that higher BMI and use of bisphosphonate were significant risk factors of AFF.[23] The development of atypical fractures is not associated with osteoporosis but pathophysiology of stress fracture due to altered bone structure and biomechanics.[24] It has been proposed that patients with long-term use of bisphosphonate may have a low bone turnover condition with impaired new bone formation and our patients with AFF are also mostly treated with anti-resorptive (93.9%, 46 of 49). In this context, we feel that clinicians should notice whether the pattern of improvement will go discordance or not to predict AFF.
The incidence of SHD was relatively low compared to similar Korean studies (Table 3). Two criteria for discordance are now used and cited in recent studies (1) a discrepancy in the BMD measurements at the 2 sites; (2) a difference between L1–4 and femur neck BMD more than 1.5 SD.[8,2528] However, it might not be related to physiologic change or the increased risk of fracture if discordance was diagnosed with a lumbar T-score of −2.4 and femur neck of −2.5. Thus, we selected the criteria of difference >1.5 SD and general criteria of discordance also need to be established.
The present study has some limitations. First, the design of our study was retrospective and included a number of patients that were relatively small. Second, we could not evaluate potential risk factors including the age of menopause or the type of osteoporosis treatment because many of our patients were too old to remember exact age.
Considering the interest in SHD, clinicians need to be aware that the pattern of T-score discordance can vary depending on the location of osteoporotic fractures. Also, a longitudinal study would be necessary to verify the pattern of T-score discordance is really related to the osteoporotic fracture location.
Ethics approval and consent to participate

The study conformed to the ethical guidelines of the World Medical Association Declaration of Helsinki and was approved by the Institutional Review Board (approval no. EUMC 2022-10-020).

Conflict of interest

Byung-Ho Yoon has been the associate editor of the Journal of Bone Metabolism since 2017. No potential conflict of interest relevant to this article was reported.

jbm-2023-30-1-87f1.jpg
Table 1
Clinical details of included patients
Table 1
AFF (N=49) FNF (N=147) P-value
Age at fracture (yr) 76.9±8.7 77.1±8.3 0.532

Female All All

Height (cm) 155.4±7.7 155.5±8.2 0.821

Weight (kg) 56.1±9.8 55.9±10.6 0.786

BMI (kg/m2) 23.2±3.8 23.1±3.7 0.740

CCI 1.53±1.1 1.51±1.0 0.656

History of osteoporosis treatment 46 (93.9) 57 (38.8) <0.01

T-score discordance <0.05
 Concordance 24 (49.0) 110 (74.8)
 LS discordance 23 (46.9) 7 (4.8)
 FL discordance 2 (4.1) 30 (20.4)

WHO classification
 Normal 1 (2.0) 0 (0.0) 0.445
 Osteopenia 6 (12.2) 28 (19.0)
 Osteoporosis 41 (83.7) 119 (81.0)

The data is presented as mean±standard deviation.

BMI, body mass index; CCI, Charlson Comorbidity Index; LS, lumbar spine; FL, femur neck low; WHO, World Health Organization; AFF, atypical femoral fracture; FNF, femur neck fracture.

Table 2
Comparison of clinical values in patients who had been treated with atypical femoral fracture and femur neck fracture
Table 2
Measures AFF (N=49) FNF (N=147)


Discordance (N=25) No (N=24) P-value Discordance (N=37) No (N=110) P-value
Age at fracture (yr) 77.3±8.7 75.2±6.9 0.114 78.3±7.8 80.2±6.9 0.241

Height (cm) 154.4±7.7 156.5±6.2 0.131 156.7±5.7 154.5±8.2 0.231

Weight (kg) 55.8±9.8 56.4±10.6 0.226 55.1±8.8 54.2±10.6 0.426

BMI (kg/m2) 23.1±4.1 23.3±3.7 0.542 22.9±1.8 22.8±2.1 0.540

BMD T-score
 Lumbar spine −3.0±1.1 −2.9±1.1 0.442 −0.5±1.27 −2.0±1.36 <0.001
 Femur neck −1.4±0.9 −2.3±1.2 <0.001 −2.3±1.04 −2.1±1.14 0.018

CCI 1.54±1.2 1.51±1.1 0.069 1.48±1.0 1.52±1.2 0.176

Previous osteoporosis treatment 25 (100.0) 21 (87.5) - 22 (59.5) 57 (51.8) 0.345

The data is presented as mean±standard deviation or N (%).

AFF, atypical femoral fracture; FNF, femur neck fracture; BMI, body mass index; BMD, bone mineral density; CCI, Charlson Comorbidity Index.

Table 3
Prevalence of T-score spine-hip discordance form previous Korean studies
Table 3
References Year Enrollment period Included fracture type N FL LL ND Mean age at Fx (yr)
Yoon et al. [10] 2022 2015–2021 Osteoporotic vertebral compression fractures 200 11 (5.5) 52 (26.0) 137 (68.5) 81.3
Lee et al. [9] 2022 2011–2020 Osteoporotic hip fractures 1,090 243 (22.3) 44 (4.0) 803 (73.7) 78.5
Choi et al. [7] 2022 2010–2021 Atypical femoral fracture 63 4 (6.3) 40 (63.5) 19 (30.2) 73.7
Lee et al. [8] 2017 2009–2016 Atypical femoral fracture/ Osteoporotic intertrochanteric fracture 48/114 3 (6.3)/− 31 (64.6)/− 14 (29.2)/ 88 (77.2) 73.0
Current study 2023 2012–2021 Atypical femoral fracture/ Osteoporotic femur neck fracture 49/147 2 (4.1)/ 30 (20.4) 23 (46.9)/ 7 (4.8) 24 (49.0)/ 110 (74.8) 76.9

FL, femur neck low; LL, lumbar low; ND, no discordance; Fx, fracture.

Download Citation

Download a citation file in RIS format that can be imported by all major citation management software, including EndNote, ProCite, RefWorks, and Reference Manager.

Format:

Include:

Different Pattern of T-Score Discordance between Patients with Atypical Femoral Fracture and Femur Neck Fracture
J Bone Metab. 2023;30(1):87-92.   Published online February 28, 2023
Download Citation

Download a citation file in RIS format that can be imported by all major citation management software, including EndNote, ProCite, RefWorks, and Reference Manager.

Format:
Include:
Different Pattern of T-Score Discordance between Patients with Atypical Femoral Fracture and Femur Neck Fracture
J Bone Metab. 2023;30(1):87-92.   Published online February 28, 2023
Close

Figure

  • 0
Different Pattern of T-Score Discordance between Patients with Atypical Femoral Fracture and Femur Neck Fracture
Image
Graphical abstract
Different Pattern of T-Score Discordance between Patients with Atypical Femoral Fracture and Femur Neck Fracture

Clinical details of included patients

AFF (N=49) FNF (N=147) P-value
Age at fracture (yr) 76.9±8.7 77.1±8.3 0.532

Female All All

Height (cm) 155.4±7.7 155.5±8.2 0.821

Weight (kg) 56.1±9.8 55.9±10.6 0.786

BMI (kg/m2) 23.2±3.8 23.1±3.7 0.740

CCI 1.53±1.1 1.51±1.0 0.656

History of osteoporosis treatment 46 (93.9) 57 (38.8) <0.01

T-score discordance <0.05
 Concordance 24 (49.0) 110 (74.8)
 LS discordance 23 (46.9) 7 (4.8)
 FL discordance 2 (4.1) 30 (20.4)

WHO classification
 Normal 1 (2.0) 0 (0.0) 0.445
 Osteopenia 6 (12.2) 28 (19.0)
 Osteoporosis 41 (83.7) 119 (81.0)

The data is presented as mean±standard deviation.

BMI, body mass index; CCI, Charlson Comorbidity Index; LS, lumbar spine; FL, femur neck low; WHO, World Health Organization; AFF, atypical femoral fracture; FNF, femur neck fracture.

Comparison of clinical values in patients who had been treated with atypical femoral fracture and femur neck fracture

Measures AFF (N=49) FNF (N=147)


Discordance (N=25) No (N=24) P-value Discordance (N=37) No (N=110) P-value
Age at fracture (yr) 77.3±8.7 75.2±6.9 0.114 78.3±7.8 80.2±6.9 0.241

Height (cm) 154.4±7.7 156.5±6.2 0.131 156.7±5.7 154.5±8.2 0.231

Weight (kg) 55.8±9.8 56.4±10.6 0.226 55.1±8.8 54.2±10.6 0.426

BMI (kg/m2) 23.1±4.1 23.3±3.7 0.542 22.9±1.8 22.8±2.1 0.540

BMD T-score
 Lumbar spine −3.0±1.1 −2.9±1.1 0.442 −0.5±1.27 −2.0±1.36 <0.001
 Femur neck −1.4±0.9 −2.3±1.2 <0.001 −2.3±1.04 −2.1±1.14 0.018

CCI 1.54±1.2 1.51±1.1 0.069 1.48±1.0 1.52±1.2 0.176

Previous osteoporosis treatment 25 (100.0) 21 (87.5) - 22 (59.5) 57 (51.8) 0.345

The data is presented as mean±standard deviation or N (%).

AFF, atypical femoral fracture; FNF, femur neck fracture; BMI, body mass index; BMD, bone mineral density; CCI, Charlson Comorbidity Index.

Prevalence of T-score spine-hip discordance form previous Korean studies

References Year Enrollment period Included fracture type N FL LL ND Mean age at Fx (yr)
Yoon et al. [10] 2022 2015–2021 Osteoporotic vertebral compression fractures 200 11 (5.5) 52 (26.0) 137 (68.5) 81.3
Lee et al. [9] 2022 2011–2020 Osteoporotic hip fractures 1,090 243 (22.3) 44 (4.0) 803 (73.7) 78.5
Choi et al. [7] 2022 2010–2021 Atypical femoral fracture 63 4 (6.3) 40 (63.5) 19 (30.2) 73.7
Lee et al. [8] 2017 2009–2016 Atypical femoral fracture/ Osteoporotic intertrochanteric fracture 48/114 3 (6.3)/− 31 (64.6)/− 14 (29.2)/ 88 (77.2) 73.0
Current study 2023 2012–2021 Atypical femoral fracture/ Osteoporotic femur neck fracture 49/147 2 (4.1)/ 30 (20.4) 23 (46.9)/ 7 (4.8) 24 (49.0)/ 110 (74.8) 76.9

FL, femur neck low; LL, lumbar low; ND, no discordance; Fx, fracture.

Table 1 Clinical details of included patients

The data is presented as mean±standard deviation.

BMI, body mass index; CCI, Charlson Comorbidity Index; LS, lumbar spine; FL, femur neck low; WHO, World Health Organization; AFF, atypical femoral fracture; FNF, femur neck fracture.

Table 2 Comparison of clinical values in patients who had been treated with atypical femoral fracture and femur neck fracture

The data is presented as mean±standard deviation or N (%).

AFF, atypical femoral fracture; FNF, femur neck fracture; BMI, body mass index; BMD, bone mineral density; CCI, Charlson Comorbidity Index.

Table 3 Prevalence of T-score spine-hip discordance form previous Korean studies

FL, femur neck low; LL, lumbar low; ND, no discordance; Fx, fracture.