Best Laboratory Screening in Diagnosing Secondary Osteoporosis and Fracture Risk Assessment Tool and the National Osteoporosis Guideline Group Performance in Determining Clinical Risk: A Cross-Sectional Evaluation of the Bone Health in Postmenopausal Brazilian Women
Article information

Abstract
Background
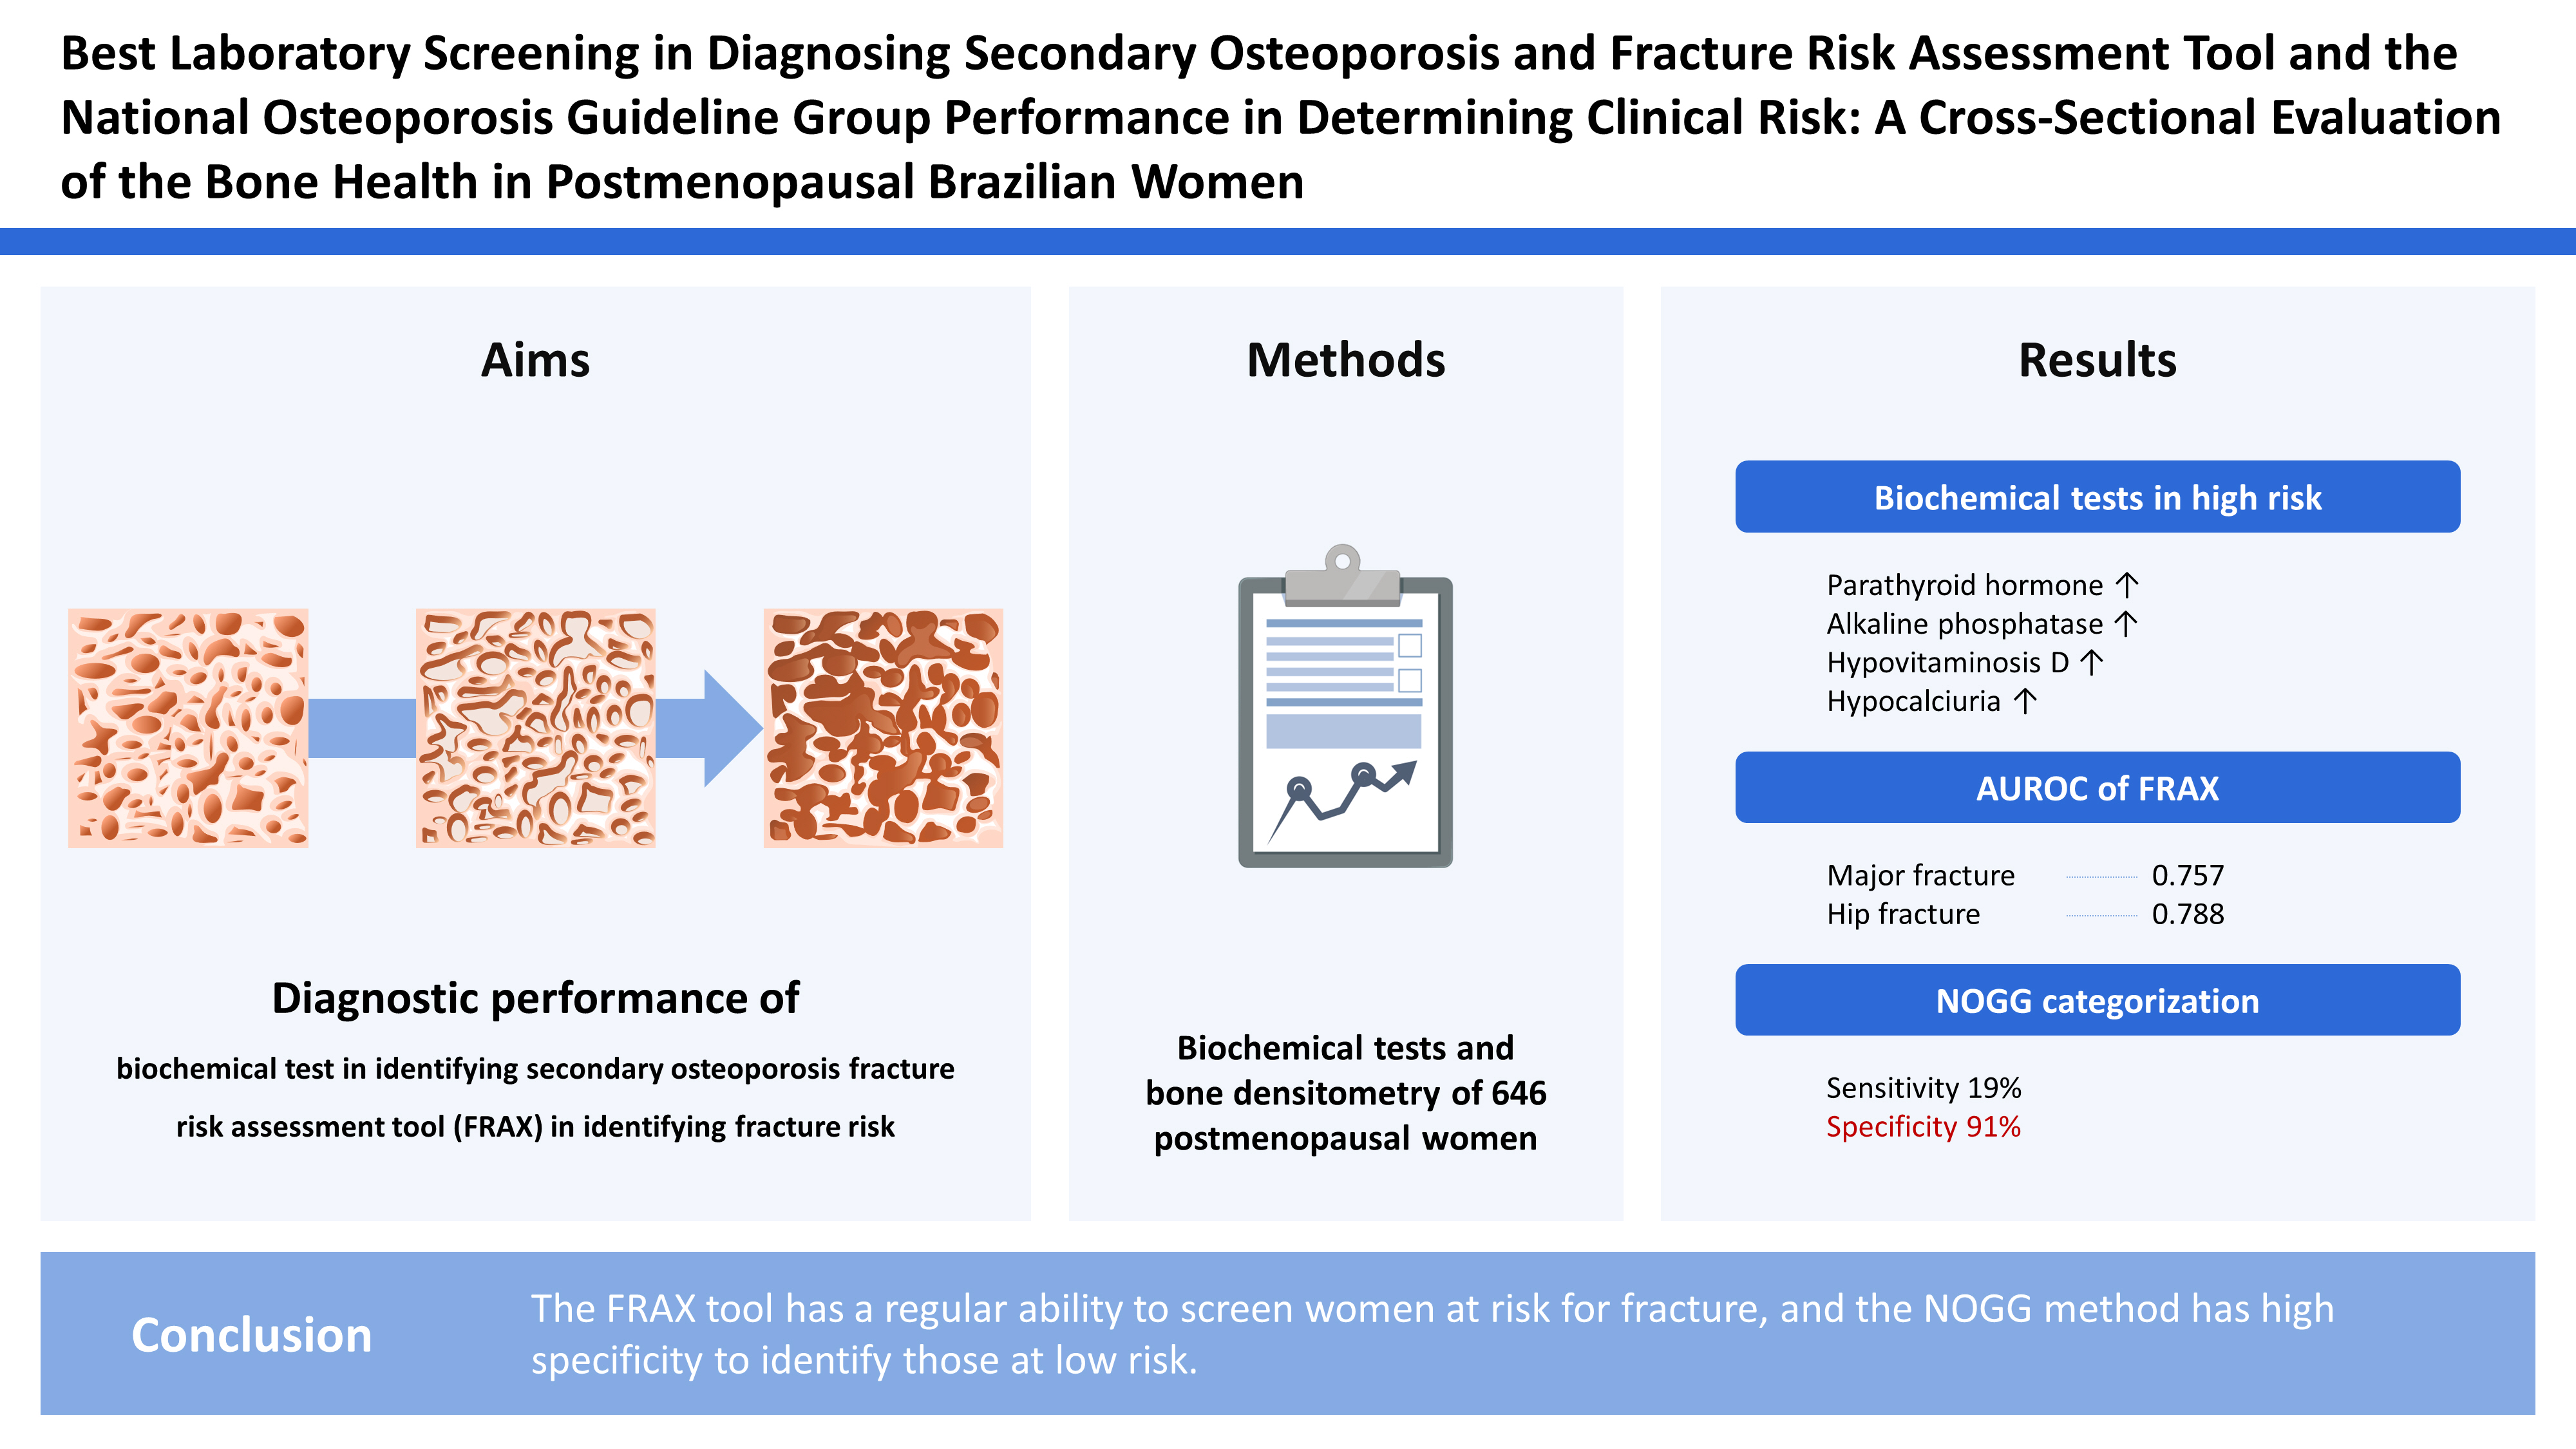
Identifying postmenopausal women with a high risk of having osteoporosis and fractures is a current challenge. This study aimed to assess the diagnostic performance of biochemical tests in identifying secondary osteoporosis and the fracture risk assessment tool (FRAX) in identifying fracture risk.
Methods
Data from biochemical tests and bone densitometry of postmenopausal women were analyzed. Additionally, the FRAX result was obtained and the patients were classified according to the National Osteoporosis Guideline Group (NOGG).
Results
A total of 646 women were evaluated, of whom 201 (31.1%) had osteoporosis or a previous frailty fracture. These women had statistically different parathyroid hormone (PTH) and alkaline phosphatase serum levels (P<0.01 and P=0.02, respectively) than those without osteoporosis or fracture. However, those at high risk had a higher prevalence of hypovitaminosis D (46% vs. 36%) and hypocalciuria (17% vs. 9%). The FRAX showed an area under the curve of 0.757 (P<0.01) and 0.788 (P<0.01) for identifying women at risk for “major fractures” and “hip,” respectively. The NOGG categorization had a sensitivity of 19% to identify high-risk women, a specificity of 91.3% for low-risk women, with a positive predictive value of 57.4% and a negative predictive value of 64.6%.
Conclusions
The evaluation of PTH, 25-hydroxy-vitamin D, serum calcium, and 24-hr urinary calcium proved adequate for initial osteoporosis screening. The FRAX tool has a regular ability to screen women at risk for fracture, and the NOGG method has high specificity to identify those at low risk.
INTRODUCTION
Osteoporosis affects more than 200 million people worldwide. Its most feared consequence, frailty fracture, is the leading cause of decreased quality of life, morbidity, and mortality in postmenopausal women.[1] In Brazil, studies estimate the prevalence of osteoporosis in postmenopausal women at 15% to 33%.[2]
Secondary osteoporosis [3,4] accounts for up to 30% of cases of osteoporosis in this period of a woman’s life.[5–7] The secondary factors involved are diverse, and their identification in an initial investigation is important for adequate care.[5,8–15] Although the orientation for complementary tests is based on the clinical history and physical examination, so far, there is no established consensus as to which ones should or should not be requested in screening for secondary osteoporosis.[16–20]
The determination of the absolute fracture risk for indication of anti-fracture treatment is based on the presence or absence of clinical risk factors for fracture and altered bone mineral density (BMD) or not. However, unlike the objective assessment of BMD by bone densitometry examination, a definition of the contribution of clinical factors is challenging. To assist the clinician in this assessment, the World Health Organization (WHO) developed the fracture risk assessment tool (FRAX). It is a clinical tool that estimates the percentage risk of fracture over the next ten years, combining the assessment of age, sex, and clinical risk factors.[21]
The Brazilian FRAX has been available for clinical use since 2013, and the Brazilian Society of Rheumatology recommends its use to indicate anti-fracture treatment in individuals with osteopenia and without previous fractures. Furthermore, based on the National Osteoporosis Guideline Group (NOGG) methodology, treatment is recommended for those with FRAX results above their age’s intervention threshold.[22] However, studies evaluating the performance of this strategy for identifying and treating postmenopausal Brazilian women are scarce.[23–28] In addition, since the launch of the tool, there have been questions about the limitation of epidemiological studies that served as a database for its calibration.[29]
Thus, this study seeks to combine BMD and laboratory data to try and identify the best laboratory strategy for initial clinical screening based on biological profile associated with secondary osteoporosis. We aim to identify which biochemical tests are relevant to identifying patients at increased risk for secondary osteoporosis and to assess the accuracy of identifying fracture risk by FRAX and its use according to the NOGG.
METHODS
1. Study design
A cross-sectional study was carried out based on the review of electronic medical records of patients treated at the climacteric and osteoporosis clinic of the Center of Women’s Health Care (Centro de Atenção Integral à Saúde da Mulher, CAISM) in São Bernardo do Campo-SP from May 2017 to August 2019. The study was approved by the Ethics and Research Committee (CEP) of the University Center of the ABC Medical School (Centro Universitário FMABC) with a certificate of presentation of ethical appraisal (CAAE) number 17348719.0.0000.0082.
2. Population
Medical records of postmenopausal women were selected, that is, women who had been in amenorrhea for at least 12 months.[30] Medical records with incomplete information for performing the FRAX were not included.
The population was categorized at low risk when they did not have osteoporosis (T-score greater than −2.5 standard deviations [SDs] in the lumbar spine or hip) and previous frailty fracture and at high risk when they had osteoporosis or a previously diagnosed or reported frailty fracture. The classification was performed based exclusively on electronic medical records evaluation.
3. Procedures
The reference limits of the analyzed laboratory tests were defined by the clinical analysis laboratory of the University Center of the ABC Medical School responsible for all tests. Laboratory analysis measured glucose by enzymatic oxidase/peroxidase, calcium by enzymatic colorimetric, 24-hr urinary calcium by a method using Arsenazo III kit, 25-hydroxy-vitamin D (25[OH]D) by electrochemiluminescence, creatinine by colorimetric/jaffe. The fasting time at the moment of the blood collection was according to the clinical laboratory specification. Whereas all the tests result included for the sample analysis were considered altered: hemoglobin <12 g/dL, creatinine >1.2 mg/dL, blood glucose >125 mg/dL, total calcium ≥10.5 mg/dL, parathyroid hormone (PTH) >65 pg/mL, 25(OH)D <30 ng/mL for insufficiency and 25(OH)D <20 ng/mL for even more relevant insufficiency (as levels higher than 20 ng/mL are recommended for healthy population up to 60 years of age and 30 ng/mL are recommended for at-risk groups), thyroid stimulating hormone (TSH) ≥4.5 mIU/L, 24-hr urinary calcium ≥300 mg/24 hr, 24-hr urinary calcium ≤60 mg/24 hr, alkaline phosphatase (ALP) >104 IU/L, free thyroxine (T4) <0.7 or >1.8 ng/dL. We emphasize that diagnosis such as hyperparathyroidism or altered renal function were obtained exclusively from laboratory exam results and not by clinical evaluation. None of the patients were attending specialized care follow-up. Patients with chronic kidney disease and moderate to severe renal insufficiency were not included in the study once these patients were referred to specialized care by the service. The criteria for the diagnosis of osteoporosis followed the WHO recommendation: T-score equal to or less than −2.5 SDs in the lumbar spine, femoral neck, or total hip.[31,32] All bone densitometry exams considered for the study were performed in a single diagnostic center that is a reference service and make use of the Lunar-DPX device. Fragility fracture presence was considered when reported in the clinical history or documented in the medical record after evaluation of the lumbosacral spine X-ray exam.
4. Collection and obtaining data
Data were obtained by reviewing electronic medical records of patients seen at least once in the CAISM climacteric or osteoporosis clinics. The pertinent information was tabulated and filed in an interface spreadsheet developed in Microsoft Excel® 2010 Software (Microsoft Corp., Redmond, WA, USA). The clinical information raised were the following: identification data (date of birth, race, and age), anthropometric data (weight and height), biochemical tests (hemoglobin, creatinine, blood glucose, total calcium, ionized calcium, PTH, 25[OH]D, TSH, T4, serum protein electrophoresis, 24-hr urinary calcium, phosphorus, ALP, and albumin), bone densitometry examination (BMD values and T-score for lumbar spine and hip. Z-score values were not considered since its controversial accuracy in identifying secondary causes of osteoporosis [33]), previous or current use of medications (calcium, vitamin D supplement, bisphosphonates, denosumab, or estrogen receptor modulators) and clinical information relevant to the FRAX questionnaire (the previous fracture reported or diagnosed on imaging exam, family history of hip fracture, use of glucocorticoids, smoking, alcohol consumption, diagnosis of rheumatoid arthritis and secondary osteoporosis).
The calculation of FRAX and categorization of the NOGG was performed using a calculator available on the Brazilian Association of Bone Assessment and Osteometabolism (ABRASSO) website. Available at https://abrasso.org.br/calculadora/calculadora/.[34] The result of the NOGG categorization was low or high risk for fracture since, in the data inclusion stage, it was standardized to consider that the patient had already undergone bone density scan.
5. Statistical analysis
The information obtained was submitted to statistical analysis using the XLSTAT® Software, version 17.01 (Addinsoft, New York, NY, USA), and Microsoft Excel® 2010 Software (Microsoft Corp.). Categorical data were presented as frequency and percentage and continuous numerical data as mean and SD. When comparing the low and high-risk groups, Student’s t-test was used for numerical variables with normal distribution and the Mann-Whitney test for those without normal distribution. For categorical variables, the χ2 test or Fisher’s exact test was used. In addition, a receiver operating characteristic curve was performed to assess the discriminative capacity of FRAX between individuals considered to be at high or low risk. The assessment of diagnostic quality based on the area under the curve (AUC) was classified as follows: in the range of 0.9 to 1.0 as excellent, 0.8 to 0.9 good, 0.7 to 0.8 fair, 0.6 to 0.7 poor, and 0.5 to 0.6 insignificant.[35]
A 2×2 cross table accessed the NOGG’s accuracy in selecting women at high or low risk was used, with individuals with densitometric osteoporosis or fracture (high risk) being the reference.
RESULTS
A total of 646 medical records were included for analysis out of 694 reviewed and 770 initially collected. Before data revision, 76 duplicated archives mistakenly tabulated more than once were excluded. Out of the 694 records left, 44 belonged to non-postmenopausal women and 2 to women in early climacteric, which did not match the inclusion criteria for the study. Finally, 2 more records of patients with incomplete medical files (meaning files missing essential laboratory, anthropometric, densitometric, clinical or identification data) were also excluded from the study. The average age of the population evaluated was 60.11±8.56 years, the body mass index of 27.58±4.63 kg/m2, the BMD of L1–4 of 0.95±0.16 g/cm2 and the BMD of femur neck 0.83±0.13 g/cm2. When comparing low-risk and high-risk individuals, it was observed that the average of these variables was significantly higher (P<0.001) in the low-risk group. All mean values of laboratory tests evaluated in the study population were within the normal range. The low and high-risk groups had an average PTH of 45.7±28 and 55.2±28 pg/mL, respectively, and the comparison showed a statistically significant difference (P<0.01). Table 1 shows the comparisons described in first and third quartiles.

Clinical, laboratory and densitometric data according to risk (N=646)
Of all the medical records analyzed, 181 (35.9%) belonged to women with osteoporosis, and 60 (9.3%) had a clinical history or radiological image of fracture. The majority (57.5%) had already used some specific treatment for bone tissue (including calcium, vitamin D supplement, bisphosphonates, denosumab, and estrogen receptor modulators), and of these, 169 (84.1%) belonged to the group considered at high risk (Table 1). The number of altered exams identified was higher in high-risk patients. PTH levels above 65 pg/mL, present in 10% of high-risk patients and only 2.5% in the low-risk group and hypocalciuria (<60 mg/24 hr) present in 37 (17%) and 29 (9%), respectively. Serum 25(OH)D levels of less than 30 ng/mL occurred in 92 (46%) of high-risk subjects, while it was less than 20 ng/mL in 33 (10%) of low-risk subjects (Table 2).
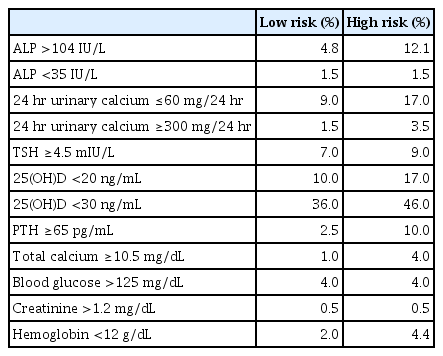
Altered laboratory results according to clinical risk
In assessing the accuracy of the NOGG methodology in selecting high or low-risk groups, a sensitivity of 19%, a specificity of 91.3%, a positive predictive value of 57.4%, and a negative predictive value of 64.6% were observed (Table 3). According to Figure 1 and Table 4, the effectiveness of the FRAX to identify a high-risk population was regular,[35] with values of 0.757 (95% confidence interval [CI], 0.709–0.806; P<0.001) for major osteoporotic fractures and 0.788 (95% CI, 0.742–0.835; P<0.001) for hip fractures. When the population under 65 years of age was selected, the operational performance reduced, with an AUC of 0.699 (95% CI, 0.630–0.768; P<0.001) and 0.749 (95% CI, 0.682–0.816; P<0.001).

Cross table between high and low NOGG results vs. osteoporosis or fracture diagnosis
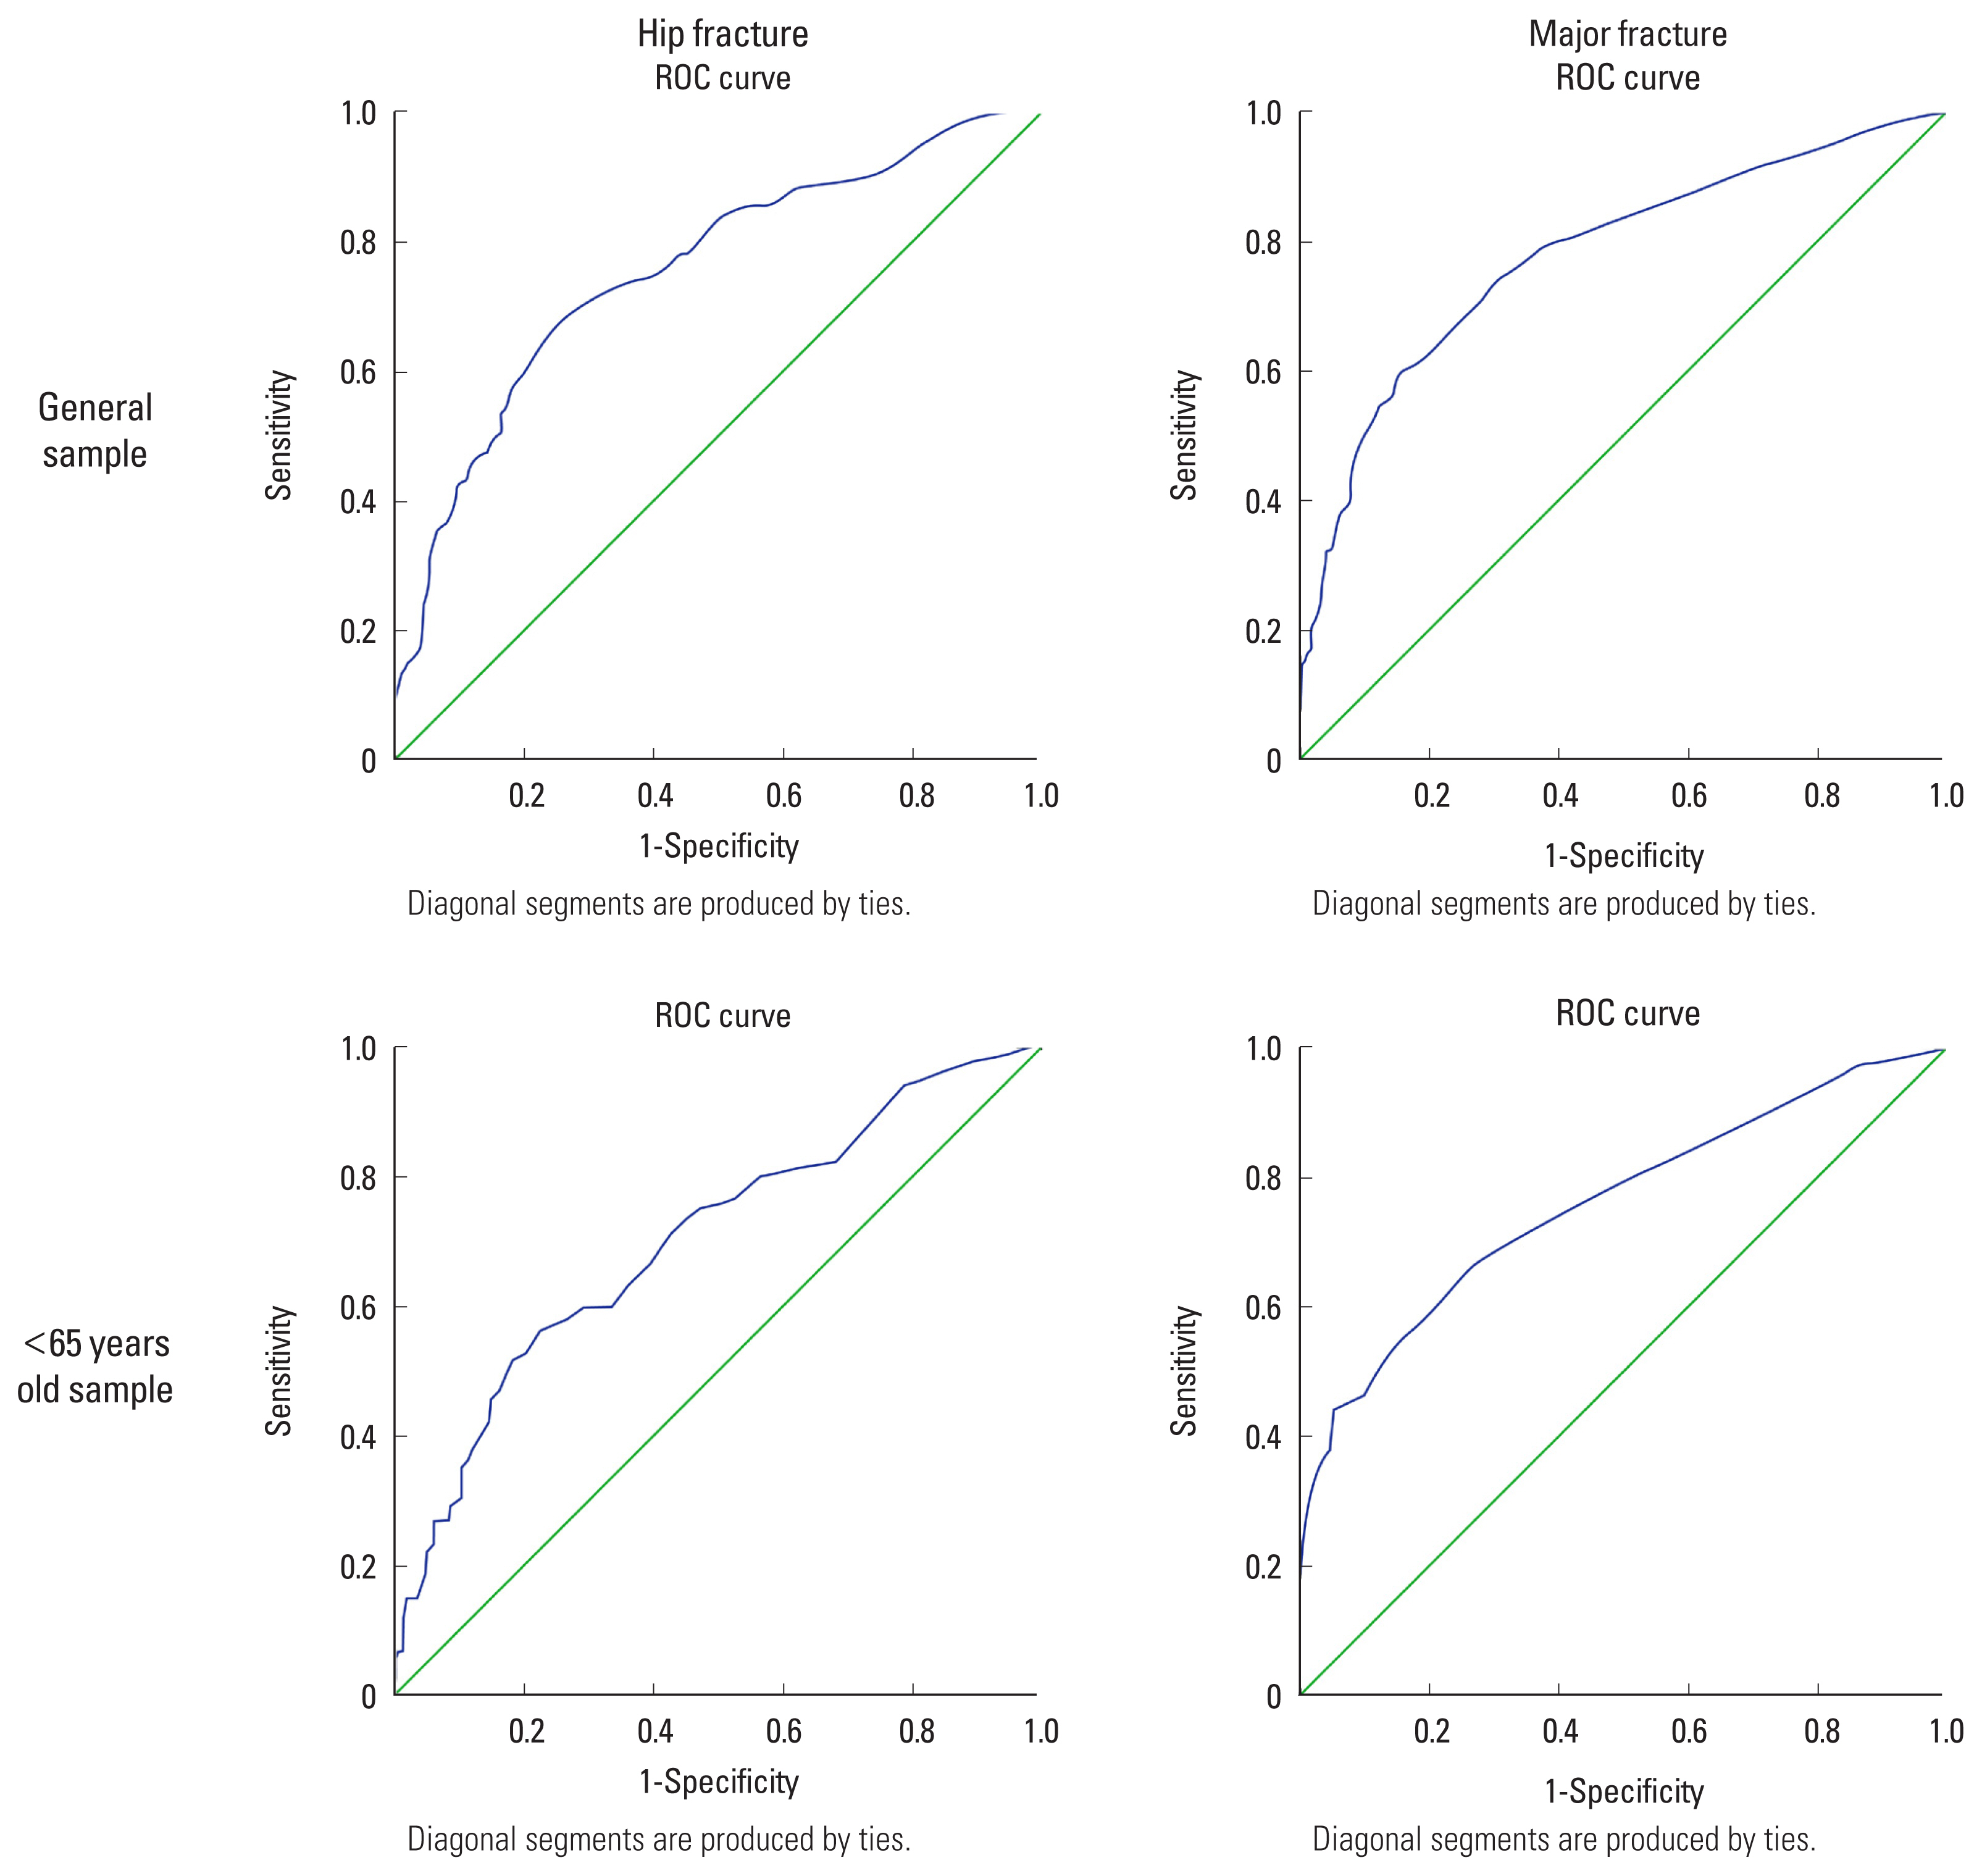
Receiver operating characteristic (ROC) curves sensitivity vs. specificity for evaluating the classification performance of fracture risk assessment tool in establishing diagnosis of osteoporosis or fracture for a general sample and under the age of 65 years.

Area under the receiver operating characteristic curve fracture risk assessment tool vs. osteoporosis or fracture diagnosis
DISCUSSION
Women with osteoporosis or at increased risk of fragility fracture should be screened for secondary osteoporosis. Identifying factors for secondary osteoporosis that negatively interferes with bone health is essential for proper clinical care.[36] The challenge is to understand which laboratory tests are cost-effective and should be routinely ordered.
There is no consensus in the literature on basic laboratory tests.[16–19] Tannenbaum et al. [17] observed that the request for 24-hr urinary calcium, serum calcium, serum PTH, and 25(OH)D with an additional request for TSH in women using thyroxine enabled the identification of 98% of the causes for secondary osteoporosis. Differently, the authors performed a secondary analysis of the Fracture Intervention Trial clinical trial and suggested that ordering routine laboratory tests in healthy postmenopausal women is not adequate and measuring TSH may be informative.[18]
In the present study, the tests that showed differences in comparing high and low-risk women were PTH and ALP, with high-risk individuals presenting high average levels. It is noteworthy, however, that the mean value of both groups is within normal limits. In the high-risk group, 4% had hypercalcemia and only 1% in the low-risk group. In addition, almost half of the high-risk population had serum levels below the recommended (<30 ng/mL) of 25(OH)D, while only 10% of the low-risk population was below 20 ng/mL (recommended). Finally, close to 20% of the high-risk population showed alterations in 24-hr urinary calcium. Therefore, although 25(OH)D, serum calcium and 24-hr urinary calcium didn’t show a statistical difference, they have been considered by us as relevant tests for the establishment of the general characterization of our sample. We assessed these results and concluded that the evaluation of PTH, 25(OH)D, serum calcium, and 24-hr urinary calcium proved adequate to differentiate the high-risk osteoporosis population from low-risk.
The identification of individuals at increased risk for fracture is essential for proper preventive and therapeutic care. In recent years, the FRAX tool has been used in different countries to assist in this identification. However, its performance and accuracy are reasons for study.[21,37,38] Authors of a recent systematic review and meta-analysis concluded that their performance was better in identifying individuals who will not have major or hip fractures in the next ten years than those who will.[37] In a cohort study of more than 54,000 women, FRAX evaluation performance found a sensitivity that ranged from 20.3% to 59.5% and a positive predictive value between 18.4% and 26%, depending on the outcome evaluated. Age was a crucial dependent factor, and the sensitivity to identify major fractures ranged from 0 to 26.3% in the age group from 40 to 49 years old and from 40% to 93.3% in the age group over 80 years.[38]
The NOGG has developed a methodology that classifies individuals at low, medium, or high risk for fracture according to performance thresholds that vary with age. A study evaluating this methodology in Chinese women in the early postmenopausal years showed poor performance in clinical practice.[39] Similarly, Bridges and Ruddick [40] identified that, of those patients hospitalized for fragility fracture, it would indicate pharmacological treatment in only 1.3%, 21.9% would indicate bone densitometry, and 76.9% would be classified as low risk. In Brazil, a study in Joinville found an accuracy of 64.2% to discriminate against individuals at high risk for fracture.[23] However, there is a recommendation for its use in clinical practice, and improvements over time would determine better performance and sensitivity.[41]
Our study observed a FRAX tracking quality considered fair, with AUC being 0.757 (95% CI, 0.709–0.806; P<0.01) and 0.788 (95% CI, 0.742–0.835; P<0.01) for major and hip fractures, respectively. Such observation allows us to consider that this tool can improve the accuracy of identifying high-risk individuals and help primary care physicians. It is worth mentioning that for patients under 65 years, the AUC for major fractures was 0.699 (95% CI, 0.630–0.768; P<0.01), which is considered a poor performance for this site. Previous studies evaluating the performance of this tool in younger populations corroborate the decrease in its performance to identify high-risk individuals.[38,42]
The use of FRAX results, evaluated according to age group as directed by the NOGG, allows classifying individuals at low and high risk when bone densitometry has already been performed. When confronted with the densitometric diagnosis of osteoporosis or the presence of fractures, such qualification demonstrated a sensitivity of identification of high-risk women of 19% and a predictive value of 57.4%. Likewise, it had a specificity of 91.3%, identifying truly low-risk individuals in almost 64.6%. Considering these results, we observe a discriminative capacity that can be useful in the clinical practice of the primary care physician.
This study has several limitations such as the small number of complementary exams, unicentric study, incomplete medical records due to non-standardized registration, and patients under current or previous treatment, most with calcium or vitamin D supplement, that could be a potential explanation for no statistically significant difference observed in 25(OH)D, serum calcium and 24 hr-urinary calcium. Also, we could rule out that the higher ALP levels in high-risk individuals than low-risk individuals within normal range might reflect high bone turnover rather than secondary osteoporosis and that higher PTH levels in high-risk individuals might reflect low 25(OH)D. It is noteworthy that the FRAX tool is validated for use in patients not treated with anti-fracture medication,[43] which may have interfered with the diagnostic accuracy observed in this study. Another confusion factor is self-medication and irregular treatment, especially observed when considering vitamin D supplementation, which can be hard to measure and avoid. We also consider that the increased risk for hypocalcemia observed in patients treated with potent antiresorptive medications such as bisphosphonates, denosumab, and estrogen receptor modulators could have affected laboratory results. Despite bone densitometry exams being performed by a Lunar-DPX device, we should mention the possibility of imprecision and incompatibility of BMD measurements among the sample. Finally, we emphasize that the study was carried out in a metropolitan city in the state of São Paulo with one of the highest recognized development index, that despite being above the national average, is below the values found for reference countries where the scientific development of the subject was first performed, [44,45] which may also be a bias among the results obtained.
On the contrary, study strengths are: complementary exams carried out in the same laboratory, all women from the exact geographical location and attended by the same physician following a unique protocol. Also, the patients’ care interval was relatively short, implying less risk of methodological variations in complementary tests, which may occur in the long term.
Despite these considerations, we believe the results obtained regarding the laboratory evaluation and the FRAX and NOGG tools are valid and promising. Doubts and consensual disagreements about initial osteoporotic screening for postmenopausal women persist, and the present study suggests that the evaluation of PTH, 25(OH)D, serum calcium, and 24-hr urinary calcium proved adequate to differentiate the high-risk osteoporosis population from low-risk. When considering the scarce information available about FRAX and NOGG clinical performance evaluation for younger postmenopausal women, our study provides new and relevant results that we believe to be of interest to scientific-academic community: The FRAX may be clinically helpful in identifying high-risk patients, and its performance is lower in the assessment of patients under 65 years of age. The NOGG tool showed a fair discriminative ability to identify low-risk patients, with adequate performance for an outpatient approach. Additional multicenter studies assessing specific age groups and risk stratification in untreated patients may add evidence to the topic. Despite the conflicting results found in the literature, we conclude that the FRAX and NOGG tools have applicability to aid clinical practice and that the individualization of biochemical tests for screening according to the profile of the local target population is an adequate strategy.
Acknowledgments
We want to thank Ricardo Crotti for kind-heartedly developing the data collection interface spreadsheet that made possible the core of our study, Caio Luiz Finco Pereira for editing and performing the final settlement of the article’s artworks and University Center of the ABC Medical School for supporting and hosting our study.
Notes
Funding
Institutional program of scientific initiation scholarships (PIBIC Institucional).
Ethics approval and consent to participate
The study was approved by the Ethics and Research Committee (CEP) of the University Center of the ABC Medical School (Centro Universitário FMABC) with certificate of presentation of ethical appraisal (CAAE) number 17348719.0. 0000.0082.
Conflict of interest
No potential conflict of interest relevant to this article was reported.