Bone Marrow Adiposity, Bone Mineral Density and Wnt/β-catenin Pathway Inhibitors Levels in Hemodialysis Patients
Article information

Abstract
Background
Marrow adipose tissue (MAT) is known to accumulate in patients with chronic kidney disease. This pilot study aimed to evaluate bone mineral density (BMD), MAT, visceral adipose tissue (VAT), and subcutaneous adipose tissue (SAT) using computed tomography (CT) scans and to explore correlations between bone parameters, circulating Wnt/β-catenin pathway inhibitor levels, and adipose tissue parameters.
Methods
Single-center cross-sectional pilot study conducted in hemodialysis patients at the Centre Universitaire de Québec, Hôtel-Dieu de Québec hospital, Canada. CT-scan slices were acquired at the levels of the hip, L3 vertebra, and tibia. Volumetric and areal BMD, tibia cortical thickness, VAT and SAT area, and fat marrow index (FMI) were analyzed using the Mindways QCT Pro software. Blood levels of sclerostin, dickkopf-related protein 1 (DKK1), fibroblast growth factor 23, and α-Klotho were assessed. Spearman’s rho test was used to evaluate correlations.
Results
Fifteen hemodialysis patients (median age, 75 [66–82] years; 80% male; dialysis vintage, 39.3 [27.4–71.0] months) were included. While inverse correlations were obtained between L3 FMI and BMD, positive correlations were found between proximal tibial FMI and vertebral and tibial BMD, as well as with tibial (proximal and distal) cortical thickness. VAT had a positive correlation with α-Klotho levels, whereas L3 FMI had a negative correlation with DKK1 levels.
Conclusions
CT-scan allows simultaneous evaluation of bone and marrow adiposity in dialysis patients. Correlations between MAT and BMD vary depending on the bone site evaluated. DKK1 and α-Klotho levels correlate with adipose tissue accumulation in dialysis patients.
INTRODUCTION
Fracture risk and cardiovascular events are significantly higher in end-stage renal disease patients compared with the general population.[1,2] The close relationship between bone anomalies and ectopic calcifications, such as vascular calcifications, has been well described [3,4] and characterizes chronic kidney disease (CKD)-mineral and bone disorder (MBD).[5] Anomalies of calcium, phosphate, parathyroid hormone, vitamin D, and acid-base status are all known to contribute to CKD-MBD.[6] Recent data suggest that Wnt/β-catenin pathway’s inhibitors (sclerostin, dickkopf-related protein 1 [DKK1] and fibroblast growth factor 23 [FGF23]) could be involved in CKD-MBD as their circulating levels were associated with bone complications. [7–9] It is already known that transient activation of Wnt/β-catenin pathway is implicated in acute kidney injury repair, while its prolonged activation has been associated with kidney fibrosis, proteinuria, and podocyte injury.[10] Similarly, recent literature suggests the potential role of marrow adipose tissue (MAT) in CKD-MBD. Indeed, increased lumbar MAT has been associated with bone loss and low bone mineral density (BMD).[11–15] The association between MAT and low BMD in osteoporotic patients and the elderly may be due to the differentiation of the bone marrow mesenchymal stem cells (MSCs) into adipocytes at the expense of osteoblasts lineages.[16–18] The explanation for the association between increased MAT and renal function is not well understood although sclerostin has been hypothesized to mediate this relationship.[14] Indeed, sclerostin is a Wnt/β-catenin pathway inhibitor and well known regulator of MSCs’ differentiation fate and adipogenesis.[18–21] Understanding the association between Wnt/β-catenin pathway inhibitors, MAT and BMD in CKD patients could thus help to better understand the mechanisms leading to CKD-MBD.
Multiple non-invasive techniques have been described to characterize bone marrow adipocytes in humans. Until now, magnetic resonance imaging (MRI) remains the most frequent modality to monitor bone marrow because of its excellent soft-tissue contrast.[13,22–24] Unfortunately, MRI is not optimal for bone characterization while computed tomography (CT) scan is a less expensive and widely available imaging modality. Moreover, it is appropriate for simultaneous bone and adipose tissue evaluation [25] while minimizing the influence of ectopic calcifications and degenerative changes on dual energy X-ray absorptiometry.[26] This pilot study thus aimed at characterizing bone parameters, MAT, subcutaneous adipose tissue (SAT) and visceral adipose tissue (VAT) in a single CT imaging procedure among hemodialysis population. The secondary objective is to evaluate the correlations between bone parameters (BMD and tibia cortical thickness), adiposity (MAT, SAT, VAT, proximal tibia fat, lipid profile), and circulating levels of Wnt/β-catenin pathway inhibitors (sclerostin, DKK1, FGF23, α-Klotho).
METHODS
1. Study design and population
This is a cross-sectional pilot study. Hemodialysis patients (≥55 years old on chronic hemodialysis for ≥3 months) from CHU de Québec-Université Laval, l’Hôtel-Dieu de Québec Hospital, were included during October and November 2017. Exclusion criteria were patients with active cancer, bone metastasis, or clinically unstable; fracture, cardiovascular event, glucocorticoids, anti-resorptive agents, or oestrogen supplements in the prior 3 months. Sex, age, body mass index (BMI), comorbidities, medication and biochemical data were collected in the patients’ electronic records. This study was approved by the CHU de Québec-Université Laval Ethics Committee (Approval no. 2018-3573) and was conducted in accordance with the 1964 Helsinki declaration and its later amendments. Written informed consent was obtained from all participants.
2. Assessment of biochemical bone parameters and Wnt/β-catenin pathway inhibitors
Plasma and serum samples were taken before the patients’ second hemodialysis session of the week, on the day before CT-scan, and were immediately centrifuged and stored at −80°C. Sclerostin (TECO medical Sclerostin HS Enzyme Immunoassay Kit, Quidel Corp., San Diego, CA, USA; intra-assay variation, 3.7%–4.2%; inter-assay variation, 4.3%–4.8%), C-terminal FGF23 (Immunotopics, San Clemente, USA; intra-assay variation, 1.4%–2.4%; inter-assay variation, 2.4%–4.7%) and α-Klotho (IBL International GMBH, Hamburg, Germany; intra-assay variation, 2.7%–3.5%; inter-assay variation, 2.9%–11.4%) levels were measured in the plasma using ELISA kits, according to the manufacturer’s instructions. DKK1 (Biomedica Immunoassays, Vienna, Austria; intra-assay variation, ≤3%; inter-assay variation, ≤3%) levels were measured in the serum using ELISA kits.
3. CT-scan imaging protocol
QCT Pro software (Mindways Software, Austin, TX, USA) was used for bone and bone marrow adiposity analysis as described before.[27] Quality control assessment was performed daily with a calibration phantom. All participants underwent CT-scans at the hip and the non-dominant tibia as well as at L3 vertebra. For the tibia scans, a scout view allowed to measure the distance between the medial malleolus and the medial knee joint cleft. Scans were performed at the distal third and the proximal third of the tibia length. At the hip, the scan was performed from the top of the femoral head to 2 cm below the lesser trochanter with a slice thickness of 1 mm at 120 kVp. At the lumbar spine and tibia, a slice thickness of 2.5 mm and 2 levels of energy (80 kVp and 140 kVp) were used to characterize MAT, as previously described.[27,28] The estimated radiation dose is around 0.25 to 0.5 mSv for the spine; 1 mSv for the hip and minimal for the tibia. In comparison, the mean total radiation dose for a thoraco-abdominal CT-scan is around 18 mSv.[29]
4. Images analyses
Imaging of model 3 QCT phantom (Mindways Software) at 80 kVp and 140 kVp allowed to derive energy-dependent X-ray attenuations from associated basis material density (different aqueous K2HPO4 composition) and theoretical density values of bone, fat marrow (FM) and hematopoietic marrow (HM). Since CT-estimated BMD decreases with the increase of MAT,[30] FM composition can be estimated when projected on a reference line defined relative to the standard bone, FM, and HM densities. The detailed methods and equations have been previously described.[27,31] Briefly, MAT was determined by the FM index (FMI) in relation to the total marrow (HM+FM): FMI=FM/(FM+HM). The original method [27] derived a computed equation calibrated to characterize the FM fraction among the total marrow mainly in a vertebra in order to correlate with the MRI-derived water to fat ratio. For this study, we thus used the same assessment method as the FM fraction. However, since the vertebra has lower Young’s modulus contents than the tibia,[13,32] the value of FM at the tibia in our study could exceed 1 and is not a fraction or percentage per se but an index for comparison means between the patients for exploratory purposes.
VAT and SAT area and volume were assessed at L4–5 interspace level using QCT Pro tissue composition analysis tool. Femoral neck areal BMD was assessed with QCT Pro CTXA Hip tool; volumetric BMD at L3 was assessed with QCT Pro 3-dimensional spine tool; BMD and cortical thickness at the tibia were assessed with QCT Pro Bone Investigational Toolkit. Areal and volumetric bone densities were analyzed with a single-energy 140 kVp dataset as previously described [27,28] since the marrow-corrected BMD has not yet been translated to clinical practice. T-scores and Z-scores have been calculated with the CTXA Femoral Neck Reference Data [33] for hip and the University of California, San Francisco database [34] for lumbar spine.
5. Statistical analyses
Data are expressed as median (25th–75th percentile) for continuous variables or frequency (%) for categorical variables. Spearman’s rho was used to evaluate correlations between bone parameters (BMD and tibia cortical thickness), adiposity (MAT, SAT, VAT, proximal tibia fat, lipid profile), and circulating levels of Wnt/β-catenin pathway inhibitors (sclerostin, DKK1, FGF23, α-Klotho). All statistical analyses were performed using SPSS 20.0 (IBM Corp., Armonk, NY, USA) and a P value less than 0.05 was considered significant. No subgroup analyses nor regression analyses were done because of the limited sample.
RESULTS
1. Patients’ characteristics
Fifteen hemodialysis patients with a median age of 75 (66–82) years old, 80% male and a median dialysis vintage of 39.3 (27.4–71.0) months were included. Six patients (40%) had type 2 diabetes and the median BMI was 27.1 (23.1–30.0) kg/m2. Nine patients (60%) had a medical history of cardiovascular disease (Table 1).

Baseline characteristics of the patients (N=15)
2. MAT and bone parameters
The total acquisition time for CT-scan was 5 min. Figure 1 shows a representative image of a scan at L3 acquired with 2 different levels of energy (80 kVp and 140 kVp). As shown in Table 2, the median FMI at L3 was lower (0.88 [0.55–1.12]) compared to the FMI values at the proximal and distal third of tibia (1.61 [1.52–1.66] and 1.52 [1.47–1.57]). Table 3 describes the bone parameters obtained at the different measured sites. The median T-score at the femoral neck and L3 were −1.98 (−2.58; −0.65) and −3.27 (−4.69; −2.33) respectively. According to the T-score, 5 (33%) patients were considered osteoporotic at the femoral neck site and 10 (67%) patients were osteoporotic at L3 vertebral site.

Example of marrow adipose tissue analysis at L3 vertebra. (A) Analysis at L3 with 80 kVp. (B) Analysis at L3 with 140 kVp.

Adipose tissue composition
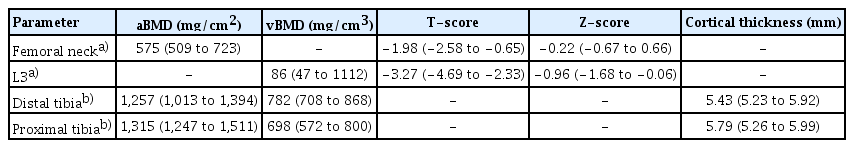
Bone parameters at the femoral neck, vertebra and tibia
3. Adipose tissue composition
Figure 2 shows a representative image of the tissue composition analysis at L3 and the distal tibia. Table 2 shows the surface area and volume of visceral and SATs obtained from our cohort.

Example of abdominal tissue composition analysis at L3. (A) The 140 kVp L3 slice with calibration phantom, (B) 140 kVp L3 slice with tissue composition analysis, and (C) 140 kVp distal tibia slice with tissue composition analysis.
4. Correlations between bone, adipose parameters and Wnt/β-catenin pathway inhibitors levels
Table 4 shows correlations that were found between FMI (measure of MAT) and bone parameters. FMI at L3 correlated inversely with same site Z-score (Spearman’s rho −0.621, P=0.013) and tended to correlate inversely with same site BMD (Spearman’s rho −0.446, P=0.095) and T-score (Spearman’s rho −0.429, P=0.111) but did not correlate with bone parameters at hip and tibia. FMI at the proximal tibia correlated positively with tibia cortical thickness, tibia and L3 BMD. FMI did not correlate with SAT, VAT, or BMI at any site. Table 5 shows correlations between Wnt/β-catenin pathway inhibitor levels, FMI, VAT, SAT, and lipid profile. Interestingly, α-Klotho correlated with VAT volume and triglycerides while DKK1 correlated inversely with the same parameters. Moreover, DKK1 also correlated inversely with FMI at L3. Sclerostin tended to correlate inversely with BMD at total hip (Spearman’s rho −0.573, P=0.066) and femoral neck (Spearman’s Rho, −0.454, P=0.089). Our study did not reveal other significant correlations between Wnt/β-catenin pathway inhibitor levels and bone parameters (Supplementary Table 1). We did not observe significant correlations between BMD and VAT or SAT.
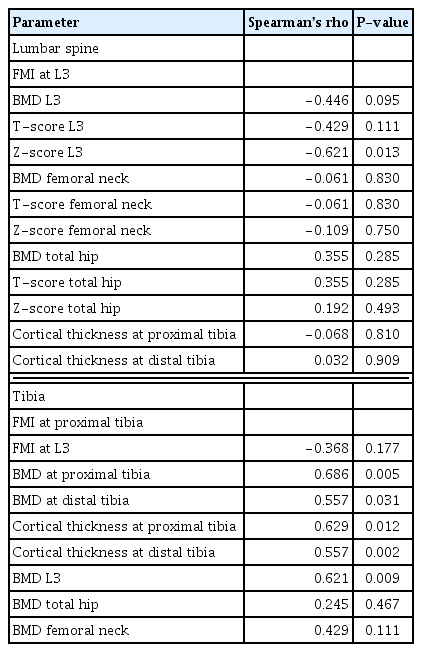
Correlations between fat marrow index and bone parameters

Correlations between Wnt/β-catenin pathway inhibitors levels and adiposity parameters
DISCUSSION
In this pilot study, we were able to: (1) characterize adipose tissues (MAT, VAT, SAT) and bone parameters simultaneously using CT-scan in hemodialysis patients; (2) report correlations between MAT and BMD that vary according to bone sites; and (3) show correlations between levels of Wnt/β-catenin pathway inhibitors and adipose tissue parameters.
With a single and simple imaging procedure, we report the feasibility of characterize MAT, adipose and bone tissue parameters by CT-scan in a hemodialysis population based on a dual energy MAT analysis, a technique that was recently used to describe bone marrow fat fraction.[27] The CT-scan acquisition is fast and widely available while allowing to evaluate simultaneously MAT, which seems to be a distinct adiposity depot,[35] and bone, 2 organs that are recognized to have close interactions.[36]
As expected, most of our patients were considered osteoporotic based on the levels of volumetric BMD. This is in line with the already well-recognized alteration of bone structure and mineral density as well as the increased bone fragility affecting dialysis population.[37,38] The results of FMI in our study are slightly higher than the FM fraction and the MRI water to fat ratio previously reported in the literature,[13,14,28,39] which is probably explained by the older age of our patients,[11,40] the fact that we studied hemodialysis population [14] and the use of different FMI assessment methods. Moreover, the predetermined reference values for hematopoietic and FM fractions were calibrated for vertebral bone marrow. Since tibia bone marrow tissue has a higher content of adipose tissue,[32] this explains why our tibia FMI could exceed the value of 1. FMI is thus more useful for comparing means instead of the absolute values. Nonetheless, the values of VAT and SAT in our cohort correspond to the range of values that were reported in other studies.[41,42] In addition, L3 MAT in our cohort tended to correlate inversely with the same site BMD, which agrees with prior published data on the inverse association between bone marrow adipocytes and BMD.[11,12,43] Only a few studies have quantified MAT in CKD populations. Both existing studies have shown a higher MAT fraction in CKD subjects when compared to healthy controls.[13,14] Hypotheses (independently from comorbidities and aging) include the potential role of Wnt/β-catenin mediated MSC differentiation fate through Wnt/β-catenin pathway inhibitors, which have been shown to impact the process of bone formation in CKD populations.[14,18, 44] As our study included only a limited number of patients and that age, gender, and diabetes [32,45,46] could also have an influence on MAT, specificities in hemodialysis population need to be better clarified in the future.
An intriguing finding of our study is the positive correlations between MAT at the proximal tibia and bone parameters, which, to the best of our knowledge, have not been previously described. The proximal tibia has more surrounding muscle and less trabecular bone than the vertebrae. This is associated with higher FMI which may influence the MAT/bone relationship. Until now, most studies focused on vertebral and hip MAT while only a few studies investigated MAT at other bone sites. Our results show that correlations between MAT and bone parameters vary according to the evaluated bone sites in humans. In agreement with our results, a recent study in rats also showed variable associations between bone parameters and MAT according to the measured site (tibia vs. mandibular bone), which is likely explained by the variable bone microarchitecture and spatial distribution of MAT.[47] Recently, a clinical study found higher marrow fat content in osteoporotic post-menopausal women at the proximal tibia but not distal tibia.[48] Clearly, these findings and ours suggest that the relationship between bone parameters and marrow fat is still not well characterized and various sites and evaluation methods should be explored in the future.
We have not observed any association between MAT and SAT, VAT, or BMI. The suggested specificity of MAT compared to the other adipose tissue depots probably explains this absence of correlation, as reported by others.[35,49] For example, while a reduction of SAT and VAT follows weight loss induced by caloric restriction, it is accompanied by increased MAT.[50]
Finally, since Wnt/β-catenin pathway is a well-characterized regulator of bone formation and adipose differentiation,[19–21,51] we further evaluated the correlations between MAT, SAT, VAT, bone parameters, lipid profile and Wnt/β-catenin pathway inhibitors levels in our hemodialysis patients. As expected, our dialysis patients had higher levels of FGF23 and lower levels of α-Klotho compared to reported levels in the general population and non-dialysis CKD.[52,53] We found a tendency but no statistically significant inverse correlations between sclerostin and hip and femoral neck BMD. This is in line with previously reported literature as sclerostin is a known inhibitor of the Wnt/β-catenin pathway and therefore of bone formation.[54] On the other hand, some evidence also suggests that sclerostin may be cleared by the dialysis session.[55] This may explain the absence of a significant correlation with bone parameters in our specific population. We also found an inverse correlation between DKK1 levels and MAT at L3 as well as VAT volume and triglycerides levels. An African-descending cohort study showed instead a positive correlation between waist circumference (r=0.15, P=0.046), total body adiposity (r=0.24, P=0.003) and BMI (r=0.15, P= 0.046) in a cohort with a similar BMI as ours. However, their cohort comprised younger patients (mean age, 63.5±8.2 years old), different ethnicities and non-CKD patients, which consequently makes our cohorts less comparable. The absence of correlation between DKK1 and MAT at other sites as well as between sclerostin and bone parameters could be attributed to the small sample of this study or site-dependent effects on MAT differentiation. The regulation of DKK1 is still not yet well understood in CKD patients [56] while our results may suggest CKD- and site-specific effects of DKK1 in the differentiation of MSCs.[21,57] In this study, the circulating levels of α-Klotho correlated with VAT and triglycerides levels but not with MAT. Our results and others [19,58] may thus suggest the preferential association between α-Klotho and energy metabolism. Taken together, the potential role of Wnt/β-catenin pathway inhibitors in the regulation of bone and adipose tissue with regards to MAT needs to be further investigated.
Our study has strengths. We were able to characterize simultaneously MAT, VAT, and SAT tissue, Wnt/β-catenin pathway inhibitors and bone parameters in hemodialysis patients. Our observation that MAT correlates with bone parameters at distant sites reinforces the need to strengthen our knowledge of the interaction between bone and MAT. On the other hand, as this is a pilot study, the small sample size is the main limitation of this study and limits the possibility to perform subgroup analysis. Furthermore, tibia FMI is not a validated site for the evaluation of marrow adiposity. However, our study aimed to be exploratory and not meant to be explicative. Future studies should include non-dialysis patients and comparison to non-CKD population allowing to study more women and compare diabetic vs. non-diabetic patients as well as osteoporotic vs. osteopenic/normal BMD patients. In addition, it would be useful to develop calibration methods that will allow to accurately estimate the absolute FM fraction in tibia with CT scan and to compare the results with MRI data.
CONCLUSION
In conclusion, a better understanding of the MAT and its relationship with other adipose tissue depots and bone parameters in the dialysis population will help better understand the pathophysiology of CKD-MBD.
Supplementary Information
Acknowledgments
We are grateful to the patients included in this study and hemodialysis’ staff for their collaboration.
Notes
Ethics approval and consent to participate
This study conformed to the ethical guidelines of the 1975 Declaration of Helsinki and was approved by the CHU de Québec-Université Laval Ethics Committee (Approval no. 2018-3573).
Conflict of interest
No potential conflict of interest relevant to this article was reported.