Associations between Body Composition, Hormonal and Lifestyle Factors, Bone Turnover, and BMD
Article information
Abstract
Background
The relative importance of body composition, lifestyle factors, bone turnover and hormonal factors in determining bone mineral density (BMD) is unknown. We studied younger postmenopausal women to determine whether modifiable or nonmodifiable risk factors for osteoporosis have stronger associations with BMD.
Methods
In multivariable linear regression models, we tested associations between non-bone body composition measures, self-reported measures of physical activity and dietary intake, urinary N-telopeptide (NTx), sex hormone concentrations, and BMD in 109 postmenopausal women aged 50 to 64 years, adjusting for current hormone therapy use and clinical risk factors for low BMD. Lean mass, fat mass and areal BMD (aBMD) at the lumbar spine, femoral neck, total hip and distal radius were measured using dual energy X-ray absorptiometry.
Results
Higher body weight and self-reported nonwhite race were independently associated with higher aBMD at the lumbar spine, femoral neck, total hip and distal radius. Lean and fat mass were not independently associated with aBMD. Older age and higher urinary NTx were independently associated with lower aBMD at the distal radius but not at weight-bearing sites. Sensitivity analyses demonstrated lack of an independent association between total daily protein or calorie intake and BMD.
Conclusions
BMD, weight and race were the most important determinants of aBMD at all sites. Older age and higher bone turnover were independently associated with lower aBMD at the distal radius. In a limited analysis, self-reported physical activity, dietary protein and calorie intake were not associated with aBMD after adjustment for the other variables.
INTRODUCTION
In postmenopausal women under age 65 years, osteoporosis prevention emphasizes modification of risk factors for low bone mineral density (BMD) in an effort to delay the onset of osteoporosis and the need for antifracture therapy. Weight and body mass index (BMI), body composition, physical activity, diet and hormonal factors have been reported to influence BMD, but the relative importance of these factors in the early postmenopausal period is uncertain.[1,2,3,4,5,6,7,8,9,10,11]
Previous studies suggest that weight and race are more important than sex hormone concentrations in predicting BMD at weight-bearing sites in postmeno pausal women under age 65.[12,13] Both fat mass and lean mass appear to affect BMD through weight loading and muscle activity that elicits local BMD gains.[4,14,15] Douchi et al.[16] found that lean body mass is a more significant determinant of postmenopausal BMD in physically exercising women than in sedentary women. However, others have proposed that fat mass may be a more significant determinant of BMD in postmenopausal women.[6,17] Nutrition may influence BMD directly or indirectly by affecting weight, muscle mass and strength.[10,18] The interplay among these factors is complex, and different factors may dominate under different conditions. For example, in a 1-year, randomized, controlled intervention trial of a weight loss and exercise program in 107 obese adults aged 65 years and older, lean body mass and BMD at the hip decreased less in the diet-exercise group than in the diet-alone group (reductions of 3% and 1% respectively in the diet-exercise group vs. reductions of 5% and 3% respectively in the diet group; P< 0.05 for both comparisons).[19] Weight loss that occurs with malnutrition may include protein deficiency that detrimentally affects lean and fat mass and BMD.[20]
To help determine whether modifiable factors are as important as nonmodifiable determinants of BMD, we tested associations between weight and body composition, physical activity and dietary measures, sex hormone concentrations and BMD in a cross-sectional study of 109 community-dwelling younger (aged 50 to 64 years) postmenopausal women, some of whom were current hormone therapy users. Based on our earlier studies, we hypothesized that weight or body composition and self-reported race would be more important determinants of BMD than physical activity, diet and endogenous hormones.
METHODS
1. Study participants
Participants were 109 community-dwelling postmenopausal women aged 50 to 64 years of mixed race and ethnicity (self-reported), recruited between 2005 and 2010 from appointment rosters from primary care clinics on a university campus or from the community by university e-mail listservs, posters, and referrals by past study participants (Fig. 1). Women were eligible for the study if they reported their last menstrual period to be over 12 months before the study visit. They were ineligible if they had ever taken an osteoporosis treatment agent (bisphosphonate, selective estrogen receptor modulator, calcitonin, teriparatide) or prescribed vitamin D or vitamin D derivative, had a contraindication to dual energy X-ray absorptiometry (DXA) or weighed greater than 305 pounds (138.3 kg). One enrolled participant was excluded because she could not provide a blood sample. The 109 selected participants included women from our earlier study of hormonal determinants of BMD, but with 2 additional exclusions: one enrolled participant was excluded after she was found to have a serum estradiol (E2) concentration of 254 pg/mL with no history of hormone use, and another was excluded due to missing physical activity measures.[12]

Selection of study participants.
The research protocol was reviewed and approved by the Institutional Review Board of the sponsoring university. Informed consent was obtained from all participants at the time of the study visit.
2. Measurements
Participants were instructed to fast and to urinate no more than once after midnight before attending a morning study visit in the university clinical research center. Serum and urine collection was completed before 10 AM, and bone imaging was completed while participants were fasting.
1) Areal BMD (aBMD) and non-bone body composition measures
aBMD was measured at the femoral neck, total femur, lumbar spine (L1-L4) and distal radius in all participants by a trained and certified radiologic technologist using DXA (Hologic Discovery densitometer; Hologic, Inc., Bedford, MA, USA). The technologist was blinded regarding the specific study hypothesis. Quality control was maintained by daily scanning of an anthropomorphic spine phantom. The coefficient of variation for the densitometer is 0.6% and the reference limits for variation are +/- 1.5%. aBMD results were recorded in grams per square centimeter, and as T scores ([BMD of participant - mean BMD of reference population]/standard deviation [SD] of BMD of reference population) based on Hologic reference norms for white and nonwhite women for the lumbar spine, total hip, femoral neck and distal radius.
Regional and whole body measurements of lean and fat mass were obtained during the same DXA scan. A research radiologist (JBR) reviewed the DXA reports.
2) Biochemical analyses
Fasting serum was analyzed for follicle stimulating hormone (FSH), luteinizing hormone (LH), E2, bioavailable testosterone (bio T), thyroid stimulating hormone (TSH), parathyroid hormone (PTH), sex hormone-binding globulin (SHBG), bone specific alkaline phosphatase (BSAP), dehydroepiandrosterone-sulfate (DHEA-S) and serum 25-hydroxy-vitamin D (25-[OH]D) as previously described.[12] We used bioavailable (free or associated with albumin in the circulation) sex steroid concentrations because they better reflect the fractions of these factors available to tissues.[11] The bioavailable E2 (bio E2) concentration was calculated by multiplying the total E2 by the fraction that was non-SHBG bound as per Khosla et al.[11] Urinary N-telopeptide (NTx) was measured using a competitive chemiluminescence immunoassay (Ortho-Clinical Diagnostics, Inc., Rochester, NY, USA). Urinary creatinine was measured using an enzymatic method (Roche Diagnostics Corp., Indianapolis, IN, USA).
3) Other independent variables
Demographic information and risk factors for low BMD were assessed by trained research assistants. Anthropometric measurements were taken by a research nurse in the UNC Clinical Translational Research Center. We chose weight as a covariate because correlations for weight vs. BMD were slightly stronger than for BMI vs. BMD in our study population.
We considered 3 single-question, self-reported measures of physical activity from the following studies: the National Health and Nutrition Examination Study (NHANES III); 2005 Centers for Disease Control and Prevention Behavioral Risk Factor Surveillance System; Study of Osteoporotic Fractures (SOF).[21,22,23,24,25] We used the following question from the Study of Osteoporotic Fractures in our statistical models because it was the only measure that showed a statistically significant association with aBMD in the exploratory analysis (P=0.014 for association between "yes" answer to SOF question and femoral neck aBMD, P=0.016 for association between "yes" answer to SOF question and total hip aBMD):
At least once a week, do you engage in any regular activity (brisk walking, jogging, bicycling, etc.) long enough to work up a sweat?
a. yes
b. less than once a week
c. no
Self-reported daily protein take and self-reported total daily calorie intake were estimated using the Block Brief nutritional inventory.[26,27]
3. Statistical analysis
1) Descriptive statistics
In the univariate analysis, means and standard deviations were calculated for demographic and anthropomorphic measures, hormonal variables, and DXA measures.
2) Multivariable analyses with aBMD outcomes
Separate multiple linear regression models were constructed for aBMD (g/cm2) at the lumbar spine, femoral neck, total hip and distal radius. We used simple (single variable) linear regression to identify those independent variables with at least one P value less than 0.05 for unadjusted associations with the aBMD outcomes, with backward selection to a total of 10 covariates. Using this approach, the covariates selected for the model were age, race, weight, current hormone therapy use, FSH, bio E2, bio T, urinary NTx, physical activity and SHBG.
Multicollinearity between weight and lean mass and fat mass precluded inclusion of all three covariates in one model. Therefore, a separate set of models was created using age, race, lean mass, fat mass, current hormone therapy use, FSH, bio E2, bio T, urinary NTx, physical activity and SHBG (identical to previous models except for substitution of lean and fat mass for weight covariate).
Statistical analyses were performed using the Stata SE 13.1 software.[28] We used the Bonferroni correction to account for multiple comparisons.[29] Using this method, P values ≤0.0125 were considered statistically significant for the four aBMD outcomes. P values greater than 0.0125 but less than 0.05 were considered near significant.
3) Sensitivity analyses for self-reported protein and calorie intake
Dietary data from the Block Brief nutritional inventory were available for 97 (89%) participants. For these women, sensitivity analyses were performed in which self-reported total daily protein intake or total daily calorie intake was included as an obligate covariate in models including weight, lean mass or fat mass as the only body composition measure.
RESULTS
1. Study population and descriptive analysis
Participants had a mean age of 57.5 years, were predominantly white (79%), and were overweight (mean BMI 29.6) on average (Table 1). Fifteen percent of the women were current users of hormone therapy. Mean aBMD was in the normal range at all anatomical sites.

Subject characteristics (n = 110)
2. Multivariable analysis with weight as a covariate
Higher weight was independently associated with higher aBMD at the lumbar spine (β=0.003, P<0.001), femoral neck (β=0.002, P=0.001) and total hip (β=0.002, P=0.001; Table 2). White race was independently associated with lower aBMD at all sites (β=-0.048 to -0.100, P≤0.003). Older age (β=-0.042, P=0.002) and urinary NTx (β=0.001, P<0.001) were independently associated with aBMD at the distal radius. Current hormone therapy, sex hormone concentrations, SHBG and self-reported regular physical activity were not significantly associated with aBMD in the adjusted models.
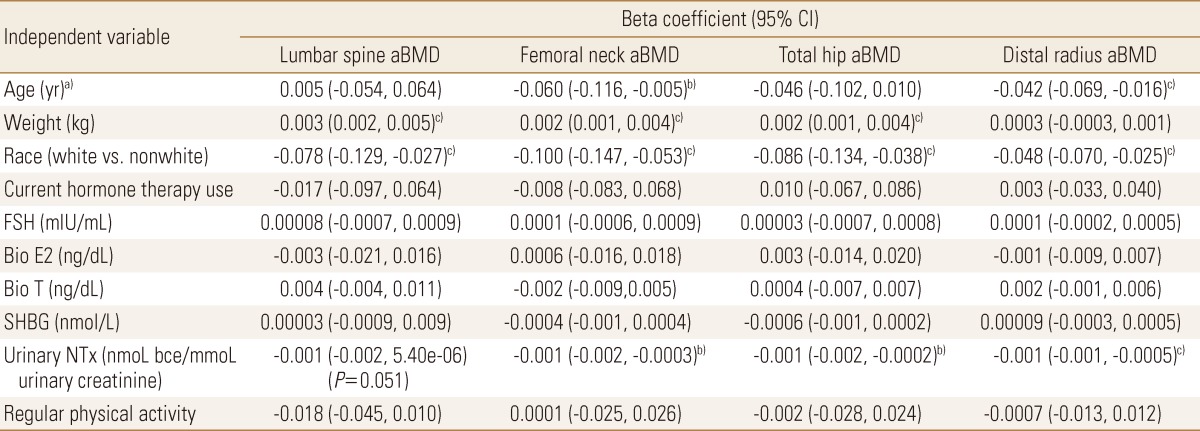
Beta coefficients for independent associations in multivariable models of bone mineral density including weight (n=109)
3. Multivariable analysis with lean mass and fat mass as covariates
When lean mass and fat mass replaced the weight covariate in the models, no significant associations were found with aBMD at any site (Table 3). Race continued to be independently associated with aBMD at all sites (β=-0.047 to -0.100, P≤0.003). Older age (β=-0.042, P=0.003) and higher concentrations of urinary NTx (β=-0.001, P<0.001) were independently associated with lower aBMD at the distal radius, and urinary NTx showed near significant associations with aBMD at all of the other sites. No other significant associations were found.
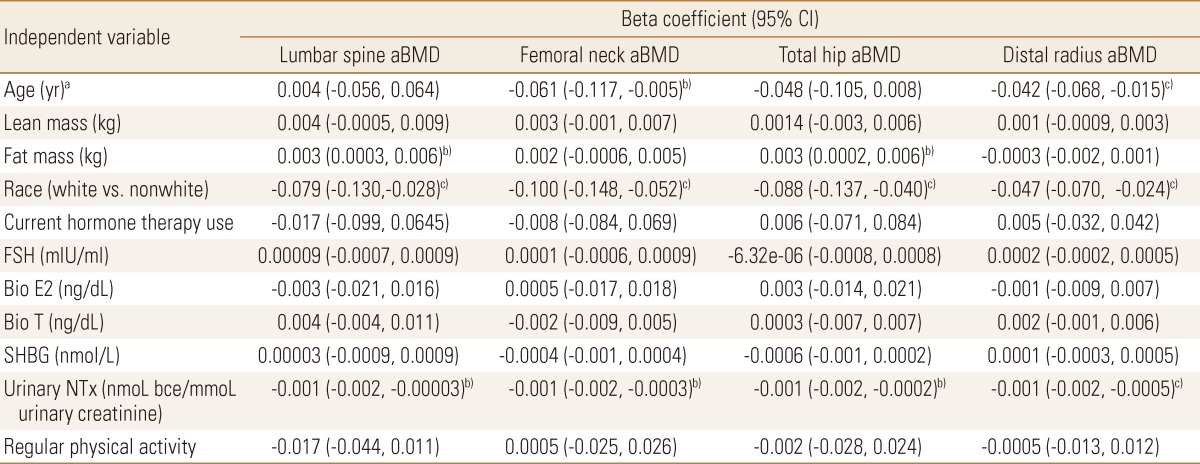
Beta coefficients for independent associations in multivariable models of bone mineral density including lean mass and fat mass (n=109)
4. Current hormone therapy use and bone turnover
Mean urinary NTx was lower in women taking hormone therapy compared to those who were not (14.7 vs. 22.8, P=0.09, student's t test), but this difference was not statistically significant.
5. Sensitivity analyses for self-reported protein and calorie intake
Addition of self-reported protein and calorie intake as covariates in the models demonstrated lack of an independent association between these measures and aBMD at any site (P=0.46 to 0.98 for association between total daily protein intake vs. aBMD at any site, P=0.19 to 0.92 for association between total daily calorie intake vs. aBMD at any site).
DISCUSSION
This cross-sectional study of postmenopausal women aged 50 to 64 years recruited from primary care practices found that lower body weight and white race were consistently independently associated with lower aBMD at all sites after adjustment for lifestyle factors, sex hormone concentrations and current hormone therapy use. Older age and higher bone turnover (as evidenced by elevated urinary NTx) were independently associated with lower aBMD at a non-weight-bearing site. Self-reported regular physical activity and protein and calorie intake were not associated with aBMD in the adjusted models.
Clinical practice guidelines universally recommend routine BMD screening for women aged 65 and older, but guidelines for younger (under age 65) postmenopausal women focus more on optimization of lifestyle measures. Our analysis suggests that weight is the most important modifiable factor in this age range. We previously found that weight and self-reported race were the most important determinants of BMD in younger postmenopausal women, and that serum FSH might be indirectly associated with BMD via an association with lean mass.[12,13] The current study further supports that BMD is more strongly associated with weight than with lean mass, fat mass, clinical risk factors for low BMD and hormonal factors. Our results are consistent with Kim et al.[2] study of 1,143 predominantly (90.6%) postmenopausal women seen in a Korean public health center, which found that weight and BMI were the predominant correlates of BMD in a multivariable analysis. A 2006 study of pre- and postmenopausal women and men showed significantly higher odds of osteoporosis and osteopenia defined by BMD in subjects with higher percent fat mass after adjustment for body weight, age, and physical activity.[30] Our results cannot be directly compared because we were unable to include both weight and fat mass in the same statistical model due to multicollinearity and small sample size.
Our results suggest that bone turnover might have a stronger association with BMD than lifestyle modification (physical activity and diet) in younger postmenopausal women. However, our study was insufficiently powered to demonstrate a significant association between current hormone therapy and urinary NTx concentrations, and we could not measure the effect of other antiresorptive agents because their use was an exclusion criterion. Although current estrogen use protects against fracture, accelerated BMD loss is seen in the first 2 years after hormone therapy cessation, and past hormone use does not confer fracture protection.[31,32,33,34] For these reasons, and because global disease harms of estrogen are likely to outweigh benefits even in women at high risk of fracture, our results do not support initiation of early or sustained hormone therapy for the purpose of attenuating BMD loss.[35]
The lack of an independent association between sex hormone concentrations, self-reported physical activity and protein and calorie intake vs. BMD in our analysis suggests that these factors are weaker correlates of BMD than race, weight and increased bone turnover. The predominance of weight-bearing effects over other factors in our studies might be characteristic of the heavier women in our study, but we included participants within a wide range of weight (nearly underweight to obese), so the results are generalizable to normal weight, overweight and obese younger postmenopausal women. Our dietary results were consistent with Earnshaw et al.[36] findings that current diet does not correlate with BMD in early postmenopausal women.
Our results should be interpreted with consideration of several limitations. Our study had cross-sectional design, which can never confirm cause/effect or a mechanistic pathway. We controlled for risk factors for low BMD to decrease bias, but confounding may still be present. However, the exploratory analysis showed that several potential confounding factors (e.g., years since menopause, FSH, serum 25-[OH]D) had weaker single-variable associations with BMD than the selected covariates, and thus were unlikely to lead to different results. Our covariates for diet (daily protein and calorie intake) and physical activity (single questions) were not comprehensive, and the physical activity question could not discriminate between high-impact exercise and low-impact activities that would have a negligible effect on BMD. The effects of diet and physical activity on BMD must be studied prospectively and in much greater detail, ideally in a randomized trial, for definitive results.
In conclusion, weight and self-reported race were most consistently independently associated with aBMD in a cross-sectional analysis that considered anthropomorphic, hormonal and lifestyle factors in postmenopausal women aged 50 to 64. Elevated concentration of a bone turnover marker was associated with lower distal radius aBMD, but was not associated with aBMD at weight-bearing sites. Maintenance of normal body weight might be the most important goal of bone health care in younger postmenopausal women.
Notes
The project described was funded by the National Institute of Arthritis and Musculoskeletal and Skin Diseases (Grant number R03AR055734), National Center for Research Resources (Grant numbers K23RR024685, M01RR00046 and UL1RR025747) and National Center for Advancing Translational Sciences (Grant number UL1TR000083). The content is solely the responsibility of the authors and does not necessarily reflect the official views of the funding agencies.
No potential conflict of interest relevant to this article was reported.