jbm > Volume 28(4); 2021 > Article
Jeong, Kim, Lim, Ha, Kang, and Baek: Effect of Romosozumab on Trabecular Bone Score Compared to Anti-Resorptive Agents in Postmenopausal Women with Osteoporosis
This article has been corrected. See J Bone Metab. 2022 Nov 30; 29(4): 279.

Abstract

Background

Romosozumab has shown significant improvement in bone mineral density (BMD) in previously reported trials. However, BMD reflects only bone strength and does not offer insight into the bone microarchitecture. The trabecular bone score (TBS) is a non-invasive tool used to assess bone microarchitecture. Several previous studies have evaluated the efficacy of anti-osteoporotic agents using the TBS. However, data regarding the potency of romosozumab based on the TBS is lacking. This retrospective observational cohort study demonstrated the impact of romosozumab use on the TBS.

Methods

The primary outcome was the percentage change in the TBS from baseline to post-treatment. Postmenopausal osteoporosis patients were followed up for 6 and 12 months after romosozumab (210 mg monthly, N =10) and denosumab (60 mg every 6 months, N=21) or ibandronate (150 mg monthly, N=24) treatments, respectively. Patients who had previously used osteoporosis medications were included, if any the washout period was sufficient.

Results

The percentage change in TBS from baseline to post-treatment was 2.53±2.98% (6 months, N=10; P=0.04), 0.59%±3.26% (12 months, N=21; P=0.48), and −0.45±3.66% (12 months, N=24; P=0.51) in the romosozumab, denosumab, and ibandronate groups, respectively. Romosozumab demonstrated a noticeable increase in TBS, although it did not reach the least significant change (5.8%) in TBS.

Conclusions

Romosozumab improved the TBS in postmenopausal women with osteoporosis. TBS may be potentially useful for monitoring romosozumab treatment.

INTRODUCTION

Osteoporosis is a major health problem in the elderly, especially in the female population. More than one-third of adult women and one-fifth of men will sustain one or more fragility fractures in their lifetime.[1] Numerous novel targets have been investigated to broad from traditional anti-osteoporotic agents. In April 2019, the Food and Drug Administration approved the new drug romosozumab, which has a novel mechanism of action, with both anabolic and anti-resorptive effects.[2,3]
Romosozumab is a humanized monoclonal antibody against c, a protein that inhibits bone formation by inhibiting canonical Wnt signaling.[4] Romosozumab showed 13.3% [2] and 13.7% [5] increases in lumbar spine bone mineral density (BMD) at month 12 in postmenopausal women with osteoporosis. These promising results are among the highest seen in previous trials.
However, BMD accounts for only 60% to 70% of bone strength.[6] BMD measures only the mineral component of bone and does not offer insight into bone microarchitecture, which is an important element for fragility fractures.[7] Therefore, interest in bone microarchitecture has emerged.[8] Trabecular bone score (TBS) is a noninvasive tool able to assess bone microarchitectural texture.[9,10] It has been included in international guidelines as an additional tool to identify and improve patients at risk for fracture and to monitor therapeutic intervention.[11]
Several studies have been published assessing the efficacy of previously approved anti-osteoporotic agents on TBS. However, there is a lack of data on the potency of the latest approved drug, romosozumab, on TBS. Furthermore, a study analyzing the effect of romosozumab on TBS compared with other anti-resorptive agents has not been published to date. We reveal here the impact of romosozumab on TBS in postmenopausal women with osteoporosis in compared to patients treated with ibandronate and denosumab.

METHODS

1. Study population

This retrospective observational cohort study was conducted in our clinic, Yeouido St. Mary’s Hospital in Korea. The subjects were postmenopausal osteoporosis patients who were administered romosozumab, denosumab, or ibandronate. As inclusion criteria, postmenopausal women who had been diagnosed with osteoporosis aged from 55 years to 85 years old were recruited. Patients who previously used osteoporosis medications were included if any, the washout period was sufficient. Insufficient washout period was defined as treatment with bisphosphonate in the last 3 years and usage of hormone replacement therapy /selective estrogen receptor modulator/denosumab in the last 1 year before enrollment. The exclusion criteria were male patients, secondary osteoporosis patients, those with any disease (e.g., uncontrolled hypo- or hyperthyroidism [thyroid stimulating hormone under 0.5 ng/mL or over 10 ng/mL], chronic kidney disease based on glomerular filtration rate <40 mL/min/1.73 m2, uncompensated liver cirrhosis, malignancy), or those taking medication that could influence bone quality (e.g., steroid, thiazolidinedione, aromatase inhibitor).
Between January 2017 and September 2018, 10 female patients who received romosozumab were followed up monthly for 6 months of treatment. For comparison, in a cohort of 60 patients treated with denosumab, 21 patients who met the inclusion criteria were involved. Likewise, in a cohort of 80 patients treated with ibandronate, 24 patients who met the inclusion criteria were enrolled. The primary outcome of interest was the percentage change from baseline in TBS by treatment. The secondary outcome was the percentage change in BMD by treatment.

2. Treatment schemes

Romosozumab (70 mg/mL, dosing volume 1 mL; Amgen Inc., Thousand Oaks, CA, USA) was supplied in single-use, prefilled syringes and administered subcutaneously (SC) in the anterior abdominal wall, upper thigh, and upper arm (cumulative dose of 210 mg romosozumab) every month for 6 months. Denosumab (60 mg; Amgen Inc.) was administered SC in the upper arm every 6 months for 12 months, and ibandronate sodium (150 mg; Handok Pharmaceuticals, Seoul, Korea) was supplied orally every month for 12 months. Throughout the treatment period, romosozumab and denosumab patients received daily elemental calcium (500-1,000 mg) and cholecalciferol (600-800 IU). Patients in the ibandronate group received monthly oral cholecalciferol (24,000 IU).

3. Measurement

BMD was assessed using dual energy X-ray absorptiometry (DXA; Hologic Inc., Bedford, MA, USA). All TBS measurements were performed using TBS iNsight software version 3.0.2.0 (Medimaps Group, Geneva, Switzerland). We used a conservative estimation of the least significant change of 5.8% for TBS, based on the largest published value.[12] BMD and TBS were assessed at baseline and month 6 after the initial administration of romosozumab or at month 12 after the initial treatment with denosumab and ibandronate.

4. Statistical analysis

Continuous variables were summarized descriptively using mean, standard deviation, and the number of available observations. Nominal categorical variables were presented as frequencies and percentages. Differences between the study groups were determined by ANOVA or Fisher’s exact test. Percentage changes in BMD and TBS were calculated as the absolute change from baseline to follow-up divided by the baseline value. The Wilcoxon signed-rank test or paired t-test was employed to evaluate the differences in percentage change from baseline for the primary and secondary outcomes. Pearson correlation coefficients were calculated for BMD vs. TBS and change from baseline in BMD vs. change in TBS. A 2-tailed P-value less than 0.05 was considered statistically significant for all analyses. All statistical analyses were performed using IBM SPSS Statistics for Windows version 24.0 (IBM Corp., Armonk, NY, USA)

RESULTS

1. Baseline characteristics

Baseline characteristics of patients who received anti-osteoporotic treatment (10 romosozumab, 21 denosumab, and 24 ibandronate) are summarized in Table 1. No statistically significant differences were found among baseline characteristics, except the history of nonvertebral fracture (P=0.05). The TBS in romosozumab, denosumab and ibandronate group were 1.303±0.075, 1.323±0.072 and 1.332 ±0.067 respectively.

2. Outcomes in TBS and BMD by study group

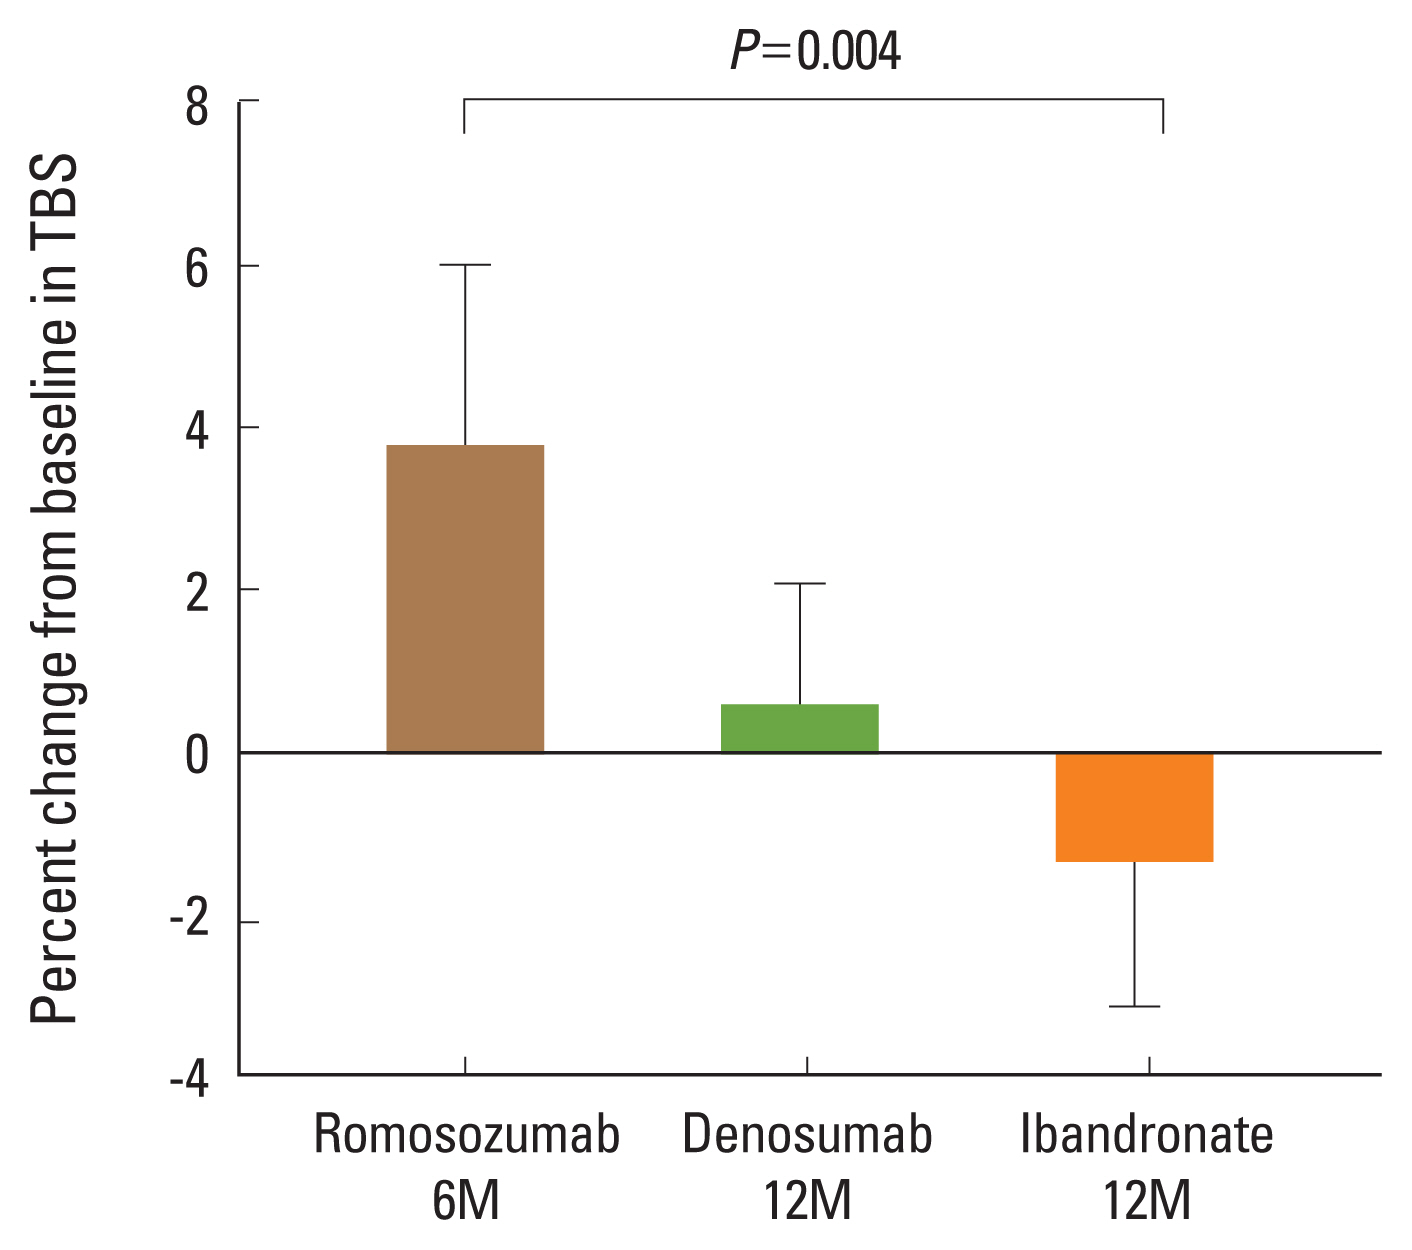
Figure 1 shows the least square (LS) mean percentage change from baseline TBS for the romosozumab (2.53±2.98%; N=10; P=0.04), denosumab (0.59±3.26%; N=21; P=0.48), and ibandronate (−0.45±3.66%; N=24; P=0.51) groups. Romosozumab demonstrated a noticeable increase in TBS, although the value did not reach the least significant change.
Figure 2 shows the LS mean percentage change from baseline in BMD between the romosozumab, denosumab, and ibandronate treatment groups. Significant increases in lumbar spine BMD were observed in each treatment group: 8.31±1.42% in romosozumab, 6.54±4.12% in denosumab, and 3.32±3.21% in ibandronate. Additionally, changes in femur neck and total hip BMD were as follows: 5.50±7.76%, P=0.05 and 4.72±5.98%, P=0.02, respectively, for romosozumab; 1.47±3.25%, P=0.05 and 1.38±2.45%, P=0.02 for denosumab; and 0.93±2.02%, P=0.04 and 0.74±1.50%, P=0.02 for ibandronate.
There was no correlation between baseline TBS and lumbar spine BMD (r2=0.0063, P=0.66) nor between femur neck BMD (r2=0.0376, P=0.16) and total hip BMD (r2=0.0234, P=0.26). Coefficients of determination between changes in BMD and changes in TBS from baseline are shown in Table 2. Only total hip BMD change in the ibandronate group revealed a significant correlation with TBS change (r2=0.7779, P=0.00).

DISCUSSION

The results of our study showed that romosozumab increases TBS in postmenopausal women with osteoporosis. By comparison, denosumab demonstrated nearly no increase in TBS, and ibandronate showed a non-significant decrease in TBS. In the romosozumab group, the increase in BMD was greatest among the treatment groups.
TBS is a novel textural index that evaluates pixel gray-level variations in the lumbar spine image projected onto a plane by DXA. TBS provides an indirect index of trabecular microarchitecture, predictive of current [13-18] and future [19,20] fragility fractures in postmenopausal women with primary osteoporosis.[9,21]
Anti-resorptive therapy, whether administered orally or parenterally, reduces cortical porosity and focal stress, thereby preventing microdamage. However, it is not known to alter bone structure. Popp et al. [22] showed a change in TBS at 36 months to be 1.41±0.79% after administration of zoledronic acid 5 mg annually for 3 years in postmenopausal women with osteoporosis. In another study, intravenous administration of ibandronate 3 mg every 3 months for 24 months resulted in a 0.3±4.1% change of TBS.[23] Denosumab, another potent anti-resorptive drug, exhibited a 1.9% increase in TBS from baseline after 12 months of therapy.[24] Our study data showed similar results, a 0.59% increase in the denosumab group and a 0.45% decrease in the ibandronate (150 mg orally) group after 12 months of treatment in postmenopausal women with osteoporosis. As shown, anti-resorptive therapy is expected to provide a “positive maintenance” of bone microarchitecture rather than a major improvement.[25] Thus, the role of TBS in monitoring anti-resorptive therapy is unclear.[12]
In contrast, anabolic agents increase cortical and trabecular thickness through the bone formation.[26] Previous studies have reported significant improvement in TBS with anabolic therapy. After 24 months of treatment with teriparatide, TBS increased 4.3±6.6% in postmenopausal women with osteoporosis.[23] Similarly, Bilezikian et al. [27] published 24 weeks of TBS data on postmenopausal women treated with abaloparatide 80 mcg SC/day and teriparatide 20 mcg SC/day. The mean increase in TBS was 4.21% in the abaloparatide-treated group and 2.21% in the teriparatide-treated group. In a population on chronic glucocorticoid treatment, Saag et al. [28] reported a mean increase in TBS of 3.7% in teriparatide-treated patients at 3 years compared with baseline. TBS is potentially useful for monitoring anabolic therapy.[12]
In our study, 24 weeks administration of romosozumab showed a 2.53% increase in TBS, reflecting an improvement of bone microarchitecture. Bone biopsies from patients in the Fracture Study in Postmenopausal Women with Osteoporosis (FRAME) trial at 12 months (N=33 placebo and N=40 romosozumab) support the results of our research.[29] They demonstrated that romosozumab-treated patients had higher cancellous bone volume, trabecular thickness, and cortical thickness on histomorphometric evaluation and superior cancellous connectivity and trabecular plate structure on micro-computed tomography than did placebo-treated patients.[29] In previous histomorphometric studies, romosozumab was the only agent showing evidence of an effect on trabecular bone volume per tissue volume after 18 months of therapy.[29-31] Since TBS is associated with bone microarchitecture parameters such as trabecular number, trabecular thickness, and connectivity,[32,33] we speculate that longer administration of romosozumab would result in a greater increase in TBS than do other approved anti-osteoporotic agents.
There are several limitations to our study. First, this study was conducted in a small population of 55 patients. Second, the efficacy of romosozumab was evaluated for only 6 months, although romosozumab is recommended to be administered for 12 months.[2,5] Statistical comparison of TBS change with other treatment groups was impossible since there was a difference in follow-up time. Third, due to the retrospective nature of the study, calcium and vitamin D supplementation protocol was different in patients with the ibandronate group. The results of the present study could be affected by this. Lastly, some laboratory findings such as bone turnover markers were not investigated in the study due to missing data in the electronic medical record. However, our data has significance as a pioneer research presenting TBS to be potentially useful for monitoring romosozumab treatment.
In conclusion, romosozumab showed improvements in TBS and BMD in postmenopausal women with osteoporosis. As far as we know, this is the first study to demonstrate the impact of romosozumab on TBS. Romosozumab is expected to be an effective drug for improving bone density and bone quality. As the observation period of this study was short, a longer follow-up investigation is needed to clarify the long-term effect of romosozumab on TBS.

DECLARATIONS

Ethics approval and consent to participate

This study was conducted in accordance with the Ethical Principles for Medical Research Involving Human Subjects outlined in the Declaration of Helsinki in 1975 (revised in 2013), International Council for Harmonisation Good Clinical Practice (ICH GCP) guidelines, and other applicable regulations or guidelines. The study protocol was approved by the Institutional Review Board (IRB) at The Catholic University Yeouido Hospital (IRB no. SC21RISI0069). Informed consent was exempted due to the retrospective nature of the study.

Conflict of interest

No potential conflict of interest relevant to this article was reported.

Fig. 1
Trabecular bone score (TBS) percentage mean changes at month 6 after treatment with romosozumab and at month 12 after treatment with denosumab or ibandronate. Error bars represent the 95% confidence interval of the mean.
jbm-2021-28-4-317f1.jpg
Fig. 2
Bone mineral density (BMD) percentage mean change at 6 months after treatment with romosozumab and at 12 months after treatment with denosumab or ibandronate. Error bars represent the 95% confidence interval of the mean.
jbm-2021-28-4-317f2.jpg
Table 1
Patients’ demographics and baseline characteristics
Romosozumab (N=10) Denosumab (N=21) Ibandronate (N=24) P-value
Age (yr) 66.8±8.1 66.0±8.6 67.3±7.6 0.91

Weight (kg) 54.8±6.5 55.0±5.9 55.3±5.7

Height (cm) 154.4±6.2 155.2±6.5 153.3±6.1

BMI (kg/m2) 23.1±3.8 22.9±2.5 24.0±2.1 0.46

Serum 25(OH)D (ng/mL) 26.2±11.0 29.7±8.1 35.6±16.0 0.16

Historical fracture
 Vertebral 0 (0.0) 2 (9.5) 1 (4.2) 0.60
 Non-vertebral 0 (0.0) 6 (28.6) 2 (8.3) 0.05

BMD (g/cm2)
 Lumbar 0.866±0.052 0.859±0.087 0.870±0.045 0.52
 Femur neck 0.672±0.117 0.709±0.066 0.713±0.106 0.19
 Total hip 0.728±0.137 0.761±0.086 0.790±0.123 0.23

Lumbar spine T-score −2.31±0.41 −2.40±0.73 −2.43±0.62 0.64

Trabecular bone score 1.303±0.075 1.323±0.072 1.332±0.067 0.60

The data is presented as mean±standard deviation or number (%).

BMI, body mass index; 25(OH)D, 25-hydroxy-vitamin D; BMD, bone mineral density.

Table 2
Coefficient of determination between changes in BMD and changes in trabecular bone score from baseline
Romosozumab (N=10) Denosumab (N=21) Ibandronate (N=24)
Change in BMD (g/cm2)
 Lumbar 0.0088 0.0056 0.0708
 Femur neck 0.0279 0.0011 0.0708
 Total hip 0.1347 0.1467 0.7779a)

a) P<0.05 in Pearson correlation analysis.

BMD, bone mineral density.

REFERENCES

1. van Staa TP, Dennison EM, Leufkens HG, et al. Epidemiology of fractures in England and Wales. Bone 2001;29:517-22. https://doi.org/10.1016/s8756-3282(01)00614-7.
crossref pmid
2. Cosman F, Crittenden DB, Adachi JD, et al. Romosozumab treatment in postmenopausal women with osteoporosis. N Engl J Med 2016;375:1532-43. https://doi.org/10.1056/NEJMoa1607948.
crossref pmid
3. McClung MR, Grauer A, Boonen S, et al. Romosozumab in postmenopausal women with low bone mineral density. N Engl J Med 2014;370:412-20. https://doi.org/10.1056/NEJMoa1305224.
crossref pmid
4. Li X, Zhang Y, Kang H, et al. Sclerostin binds to LRP5/6 and antagonizes canonical Wnt signaling. J Biol Chem 2005;280:19883-7. https://doi.org/10.1074/jbc.M413274200.
crossref pmid
5. Saag KG, Petersen J, Brandi ML, et al. Romosozumab or alendronate for fracture prevention in women with osteoporosis. N Engl J Med 2017;377:1417-27. https://doi.org/10.1056/NEJMoa1708322.
crossref pmid
6. Dalle Carbonare L, Giannini S. Bone microarchitecture as an important determinant of bone strength. J Endocrinol Invest 2004;27:99-105. https://doi.org/10.1007/bf03350919.
crossref pmid
7. Majumdar S. A review of magnetic resonance (MR) imaging of trabecular bone micro-architecture: contribution to the prediction of biomechanical properties and fracture prevalence. Technol Health Care 1998;6:321-7.
crossref pmid
8. Kong SH, Hong N, Kim JW, et al. Application of the trabecular bone score in clinical practice. J Bone Metab 2021;28:101-13. https://doi.org/10.11005/jbm.2021.28.2.101.
crossref pmid pmc
9. Silva BC, Leslie WD, Resch H, et al. Trabecular bone score: a noninvasive analytical method based upon the DXA image. J Bone Miner Res 2014;29:518-30. https://doi.org/10.1002/jbmr.2176.
crossref pmid
10. Ramalho J, Marques IDB, Hans D, et al. The trabecular bone score: Relationships with trabecular and cortical microarchitecture measured by HR-pQCT and histomorphometry in patients with chronic kidney disease. Bone 2018;116:215-20. https://doi.org/10.1016/j.bone.2018.08.006.
crossref pmid
11. Silva BC, Broy SB, Boutroy S, et al. Fracture risk prediction by non-BMD DXA measures: the 2015 ISCD official positions part 2: Trabecular bone score. J Clin Densitom 2015;18:309-30. https://doi.org/10.1016/j.jocd.2015.06.008.
crossref pmid
12. Krohn K, Schwartz EN, Chung YS, et al. Dual-energy X-ray absorptiometry monitoring with trabecular bone score: 2019 ISCD official position. J Clin Densitom 2019;22:501-5. https://doi.org/10.1016/j.jocd.2019.07.006.
crossref pmid
13. Leib E, Winzenrieth R, Lamy O, et al. Comparing bone microarchitecture by trabecular bone score (TBS) in Caucasian American women with and without osteoporotic fractures. Calcif Tissue Int 2014;95:201-8. https://doi.org/10.1007/s00223-014-9882-3.
crossref pmid
14. Touvier J, Winzenrieth R, Johansson H, et al. Fracture discrimination by combined bone mineral density (BMD) and microarchitectural texture analysis. Calcif Tissue Int 2015;96:274-83. https://doi.org/10.1007/s00223-015-9952-1.
crossref pmid
15. Rabier B, Héraud A, Grand-Lenoir C, et al. A multicentre, retrospective case-control study assessing the role of trabecular bone score (TBS) in menopausal Caucasian women with low areal bone mineral density (BMDa): Analysing the odds of vertebral fracture. Bone 2010;46:176-81. https://doi.org/10.1016/j.bone.2009.06.032.
crossref pmid
16. Winzenrieth R, Dufour R, Pothuaud L, et al. A retrospective case-control study assessing the role of trabecular bone score in postmenopausal Caucasian women with osteopenia: analyzing the odds of vertebral fracture. Calcif Tissue Int 2010;86:104-9. https://doi.org/10.1007/s00223-009-9322-y.
crossref pmid
17. Del Rio LM, Winzenrieth R, Cormier C, et al. Is bone microarchitecture status of the lumbar spine assessed by TBS related to femoral neck fracture? A Spanish case-control study. Osteoporos Int 2013;24:991-8. https://doi.org/10.1007/s00198-012-2008-8.
crossref pmid
18. Nassar K, Paternotte S, Kolta S, et al. Added value of trabecular bone score over bone mineral density for identification of vertebral fractures in patients with areal bone mineral density in the non-osteoporotic range. Osteoporos Int 2014;25:243-9. https://doi.org/10.1007/s00198-013-2502-7.
crossref pmid
19. Hans D, Goertzen AL, Krieg MA, et al. Bone microarchitecture assessed by TBS predicts osteoporotic fractures independent of bone density: the Manitoba study. J Bone Miner Res 2011;26:2762-9. https://doi.org/10.1002/jbmr.499.
crossref pmid
20. Boutroy S, Hans D, Sornay-Rendu E, et al. Trabecular bone score improves fracture risk prediction in non-osteoporotic women: the OFELY study. Osteoporos Int 2013;24:77-85. https://doi.org/10.1007/s00198-012-2188-2.
crossref pmid
21. McCloskey EV, Odén A, Harvey NC, et al. A meta-analysis of trabecular bone score in fracture risk prediction and its relationship to FRAX. J Bone Miner Res 2016;31:940-8. https://doi.org/10.1002/jbmr.2734.
crossref pmid
22. Popp AW, Guler S, Lamy O, et al. Effects of zoledronate versus placebo on spine bone mineral density and microarchitecture assessed by the trabecular bone score in postmenopausal women with osteoporosis: a three-year study. J Bone Miner Res 2013;28:449-54. https://doi.org/10.1002/jbmr.1775.
crossref pmid
23. Senn C, Günther B, Popp AW, et al. Comparative effects of teriparatide and ibandronate on spine bone mineral density (BMD) and microarchitecture (TBS) in postmenopausal women with osteoporosis: a 2-year open-label study. Osteoporos Int 2014;25:1945-51. https://doi.org/10.1007/s00198-014-2703-8.
crossref pmid
24. McClung MR, Lippuner K, Brandi ML, et al. Effect of denosumab on trabecular bone score in postmenopausal women with osteoporosis. Osteoporos Int 2017;28:2967-73. https://doi.org/10.1007/s00198-017-4140-y.
crossref pmid
25. Rizzoli R, Chapurlat RD, Laroche JM, et al. Effects of strontium ranelate and alendronate on bone microstructure in women with osteoporosis. Results of a 2-year study. Osteoporos Int 2012;23:305-15. https://doi.org/10.1007/s00198-011-1758-z.
crossref pmid
26. Seeman E, Delmas PD. Bone quality--the material and structural basis of bone strength and fragility. N Engl J Med 2006;354:2250-61. https://doi.org/10.1056/NEJMra053077.
crossref pmid
27. Bilezikian JP, Hattersley G, Fitzpatrick LA, et al. Abaloparatide-SC improves trabecular microarchitecture as assessed by trabecular bone score (TBS): a 24-week randomized clinical trial. Osteoporos Int 2018;29:323-8. https://doi.org/10.1007/s00198-017-4304-9.
crossref pmid
28. Saag KG, Agnusdei D, Hans D, et al. Trabecular bone score in patients with chronic glucocorticoid therapy-induced osteoporosis treated with alendronate or teriparatide. Arthritis Rheumatol 2016;68:2122-8. https://doi.org/10.1002/art.39726.
crossref pmid
29. Chavassieux P, Chapurlat R, Portero-Muzy N, et al. Bone-forming and antiresorptive effects of romosozumab in postmenopausal women with osteoporosis: Bone histomorphometry and microcomputed tomography analysis after 2 and 12 months of treatment. J Bone Miner Res 2019;34:1597-608. https://doi.org/10.1002/jbmr.3735.
crossref pmid
30. Arlot M, Meunier PJ, Boivin G, et al. Differential effects of teriparatide and alendronate on bone remodeling in postmenopausal women assessed by histomorphometric parameters. J Bone Miner Res 2005;20:1244-53. https://doi.org/10.1359/jbmr.050309.
crossref pmid
31. Moreira CA, Fitzpatrick LA, Wang Y, et al. Effects of abaloparatide-SC (BA058) on bone histology and histomorphometry: The ACTIVE phase 3 trial. Bone 2017;97:314-9. https://doi.org/10.1016/j.bone.2016.11.004.
crossref pmid
32. Pothuaud L, Carceller P, Hans D. Correlations between grey-level variations in 2D projection images (TBS) and 3D microarchitecture: applications in the study of human trabecular bone microarchitecture. Bone 2008;42:775-87. https://doi.org/10.1016/j.bone.2007.11.018.
crossref pmid
33. Hans D, Barthe N, Boutroy S, et al. Correlations between trabecular bone score, measured using anteroposterior dual-energy X-ray absorptiometry acquisition, and 3-dimensional parameters of bone microarchitecture: an experimental study on human cadaver vertebrae. J Clin Densitom 2011;14:302-12. https://doi.org/10.1016/j.jocd.2011.05.005.
crossref pmid


ABOUT
ARTICLE CATEGORY

Browse all articles >

BROWSE ARTICLES
EDITORIAL POLICY
FOR CONTRIBUTORS
Editorial Office
#1001, Hyundai Kirim Officetel, 42 Seocho-daero 78-gil, Seocho-gu, Seoul 06626, Korea
Tel: +82-2-3473-2231    Fax: +82-70-4156-2230    E-mail: jbm@ksbmr.org                

Copyright © 2024 by The Korean Society for Bone and Mineral Research.

Developed in M2PI

Close layer
prev next