Cross-Calibration of Bone Mineral Densities and Body Composition between GE Lunar Prodigy and Osteosys Primus
Article information

Abstract
Background
The aim of this study was to investigate the correlation between bone mineral density (BMD) and body composition measured by the Osteosys Primus® and the GE Lunar Prodigy® and to calculate the conversion rate between the 2 devices.
Methods
The 40 subjects were men and women in aged 20 to 29 years old. All participants were scanned twice on both the Osteosys Primus (OsteoSys) and the GE Lunar Prodigy (GE Healthcare) DXA systems using the manufacturers’ standard scanning and positioning protocols.
Results
Compared to the GE Lunar device, the mean Osteosys fat mass was overestimated to be 12.1% (1,776.9 g) in the whole body, 5.1% (163.9 g) in gynoid, and 6.7% (87.2 g) in android. Compared with the GE Lunar device, the mean BMDs of the Osteosys Primus were underestimated to be 2.3% (0.023 g/cm2) in the whole body and 3.1% (0.035 g/cm2) in L1-4. Compared with the GE Lunar device, the mean lean mass derived by the Osteosys Primus were underestimated to 2.3% (1,045.3 g) in the total body, 3.8% (179.4 g) in arms, and 7.7% (1,104.8 g) in legs, respectively. There were a strong correlation of BMD and body composition between both groups.
Conclusions
Linear correction equations were developed to ensure comparability of BMD and muscle mass between the Osteosys Primus and the GE Lunar Prodigy. Importantly, use of equations from previous studies would have increased the discrepancy between the Osteosys Primus and the GE Lunar Prodigy.
INTRODUCTION
Osteoporosis is a disease of bone metabolism characterized by the loss of bone mass and microarchitectural alterations, which result in bone fragility and an increased risk of fractures.[1–3] Representative diagnostic tools for osteoporosis are the measurement of bone mineral density (BMD) and biochemical markers.[4] Recently, the measurement of body composition has been emphasized by the addition of sarcopenic diseases.[5–8]
The most common method used to measure BMD or body composition is dual energy X-ray absorptiometry (DXA).[9,10] DXA scans are often used because they are safe, accurate, and precise.[11] Advances in densitometric technology have been made over the last few decades, including replacing pencil beams with fan beams, higher output X-ray tubes, reduced pixel size, multiple detectors, wider transverse scanning widths, faster scanning times, improved accuracy, and scanning beds to accommodate higher body weights for patients.[12]
However, as different instruments are developed, the measurement values of the various devices differ.[6,13] Therefore, many studies have been conducted to develop a conversion formula to analyze the differences between the various instruments and for calibrating the measurement values between the different devices.
Osteosys Primus® (OsteoSys, Seoul, Korea) is a fan beam-type DXA equipment developed in Korea. Measurements made by this equipment should correlate with the values of BMD and muscle mass measured by the commonly-used GE Lunar Prodigy® (GE Healthcare, Madison WI, USA).
The hypothesis of this study was that there would be a very high correlation between BMD and muscle mass between Osteosys Primus and GE Lunar Prodigy. Therefore, this study aimed to investigate the correlation between BMD and muscle mass measured by Osteosys Primus® and GE Lunar Prodigy®. In addition, we calculated the conversion formula between the 2 devices.
METHODS
1. Study group
The 40 subjects were men and women aged 20 to 29 years old. Study subjects with a body mass index (BMI) greater than or equal to 17 kg/m2 and less than or equal to 35 kg/m2 with a negative pregnancy test at the time of screening, and participants who voluntarily participated in the study and provided written consent were included in the study. The study exclusion criteria were those with scoliosis, osteoarthritis, osteomalacia, or other clinical vertebral deformities, adverse events after previous DXA or radiography, pregnant or lactating women, artificial pacemakers, or implanted cardiac pacemakers, and patients with mental illnesses, such as severe depression.
Ethical approval for the study was provided by the Chung-Ang University Hospital Research Ethics Committee and informed signed consent was provided by all participants before the scans were obtained.
2. DXA measurements
All participants were scanned twice on the Osteosys Primus and the GE Lunar Prodigy DXA systems using each manufacturer’s standard scanning and positioning protocols.
The arms and trunk were separated through the glenohumeral joints by lines, and the trunk and legs were separated at 45° to the sagittal plane of the body image by lines obliquely through the hip joint. A transverse line below the mandible excluded the head from the trunk region. The trunk included the thorax, the abdomen, the pelvis, and a portion of the medial thigh. The android region of interest (ROI) was at the lower pelvis cut boundary and the upper boundary was above the pelvis cut, 20% of the pelvis-neck cut distance. The arm cuts were the lateral boundaries. The upper limit of the gynoid ROI was 1.5 times the height of the android ROI below the pelvis, and the height of the gynoid ROI was 2 times the height of the android ROI. The external leg cuts were the lateral boundaries. For consistency, the same experienced and the International Society for Clinical Densitometry-certified clinical densitometrist performed manual ROI analysis of each scan.
3. Statistical analyses
The null hypothesis was that the correlation coefficient between the 2 instruments was 0.8 or more for each measurement site. The sample was calculated to require 36 subjects by correcting the power according to the alternative hypothesis at 5% of the significance level and 80% of the power. A total of 40 subjects were needed, considering a dropout rate of 10%. The number of samples was calculated using G Power version 3.1.9.2 (Heinrich-Heine-Universität, Düsseldorf, Germany). To assess accuracy, we plotted the differences for a particular manufacturer between each replicate BMD and lean mass measurement and the estimated true value and calculated the agreement limits as defined by Bland and Altman. Concordance correlation coefficient was used to analyze the correlation between both devices to determine precision and accuracy. A correlation coefficient between 0.2 and 0.4 was considered to be weakly correlated, between 0.4 and 0.6 was considered to be moderate, between 0.6 and 0.8 was strongly correlated, and between 0.8 and 1.0 was very strongly correlated.[14]
To calculate the conversion formula, the relationship between the Osteosys Primus and the GE Lunar software was defined using linear regression. All statistical analyses were performed using R Statistical Software (version 3.4.1; The R Foundation for Statistical Computing, Vienna, Austria).
RESULTS
Forty subjects were included in the study. There were no dropouts. The mean age of the subjects was 24.9 years (standard deviation [SD], 1.69; range, 20–29 years). There were 26 men (65%) and 14 women (35%) in the study. The mean body weight was 24.9 kg (SD, 1.69; range, 40–80 kg) and the mean height was 169.74 cm (SD, 8.61; range, 151–187 cm). The BMI was 21.72 (SD, 2.26; range, 17.53–26.73) (Table 1).

Demographic characteristics included study
Compared to the GE Lunar Prodigy, the voltage and current were high in the Osteosys Primus instrument, pixel size was small and scan times were longer by 9 min (Table 2). Table 3 summarizes the composition of the body and the BMD data of the entire body. Table 3 also illustrates the mean difference and the limits of the Bland and Altman plots. The mean difference was significantly different from zero for fat mass (FM; P<0.001), whole-body bone mineral contents (BMCs; P<0.001), whole-body BMDs (P<0.001), and lean mass (P<0.001). Figure 1 is the Bland and Altman plot for the body composition and whole-body BMD data.

Comparison of GE Lunar Prodigy and Osteosys Primus scan parameters

Summary of the Bland and Altman plots for the body composition and whole body BMD data
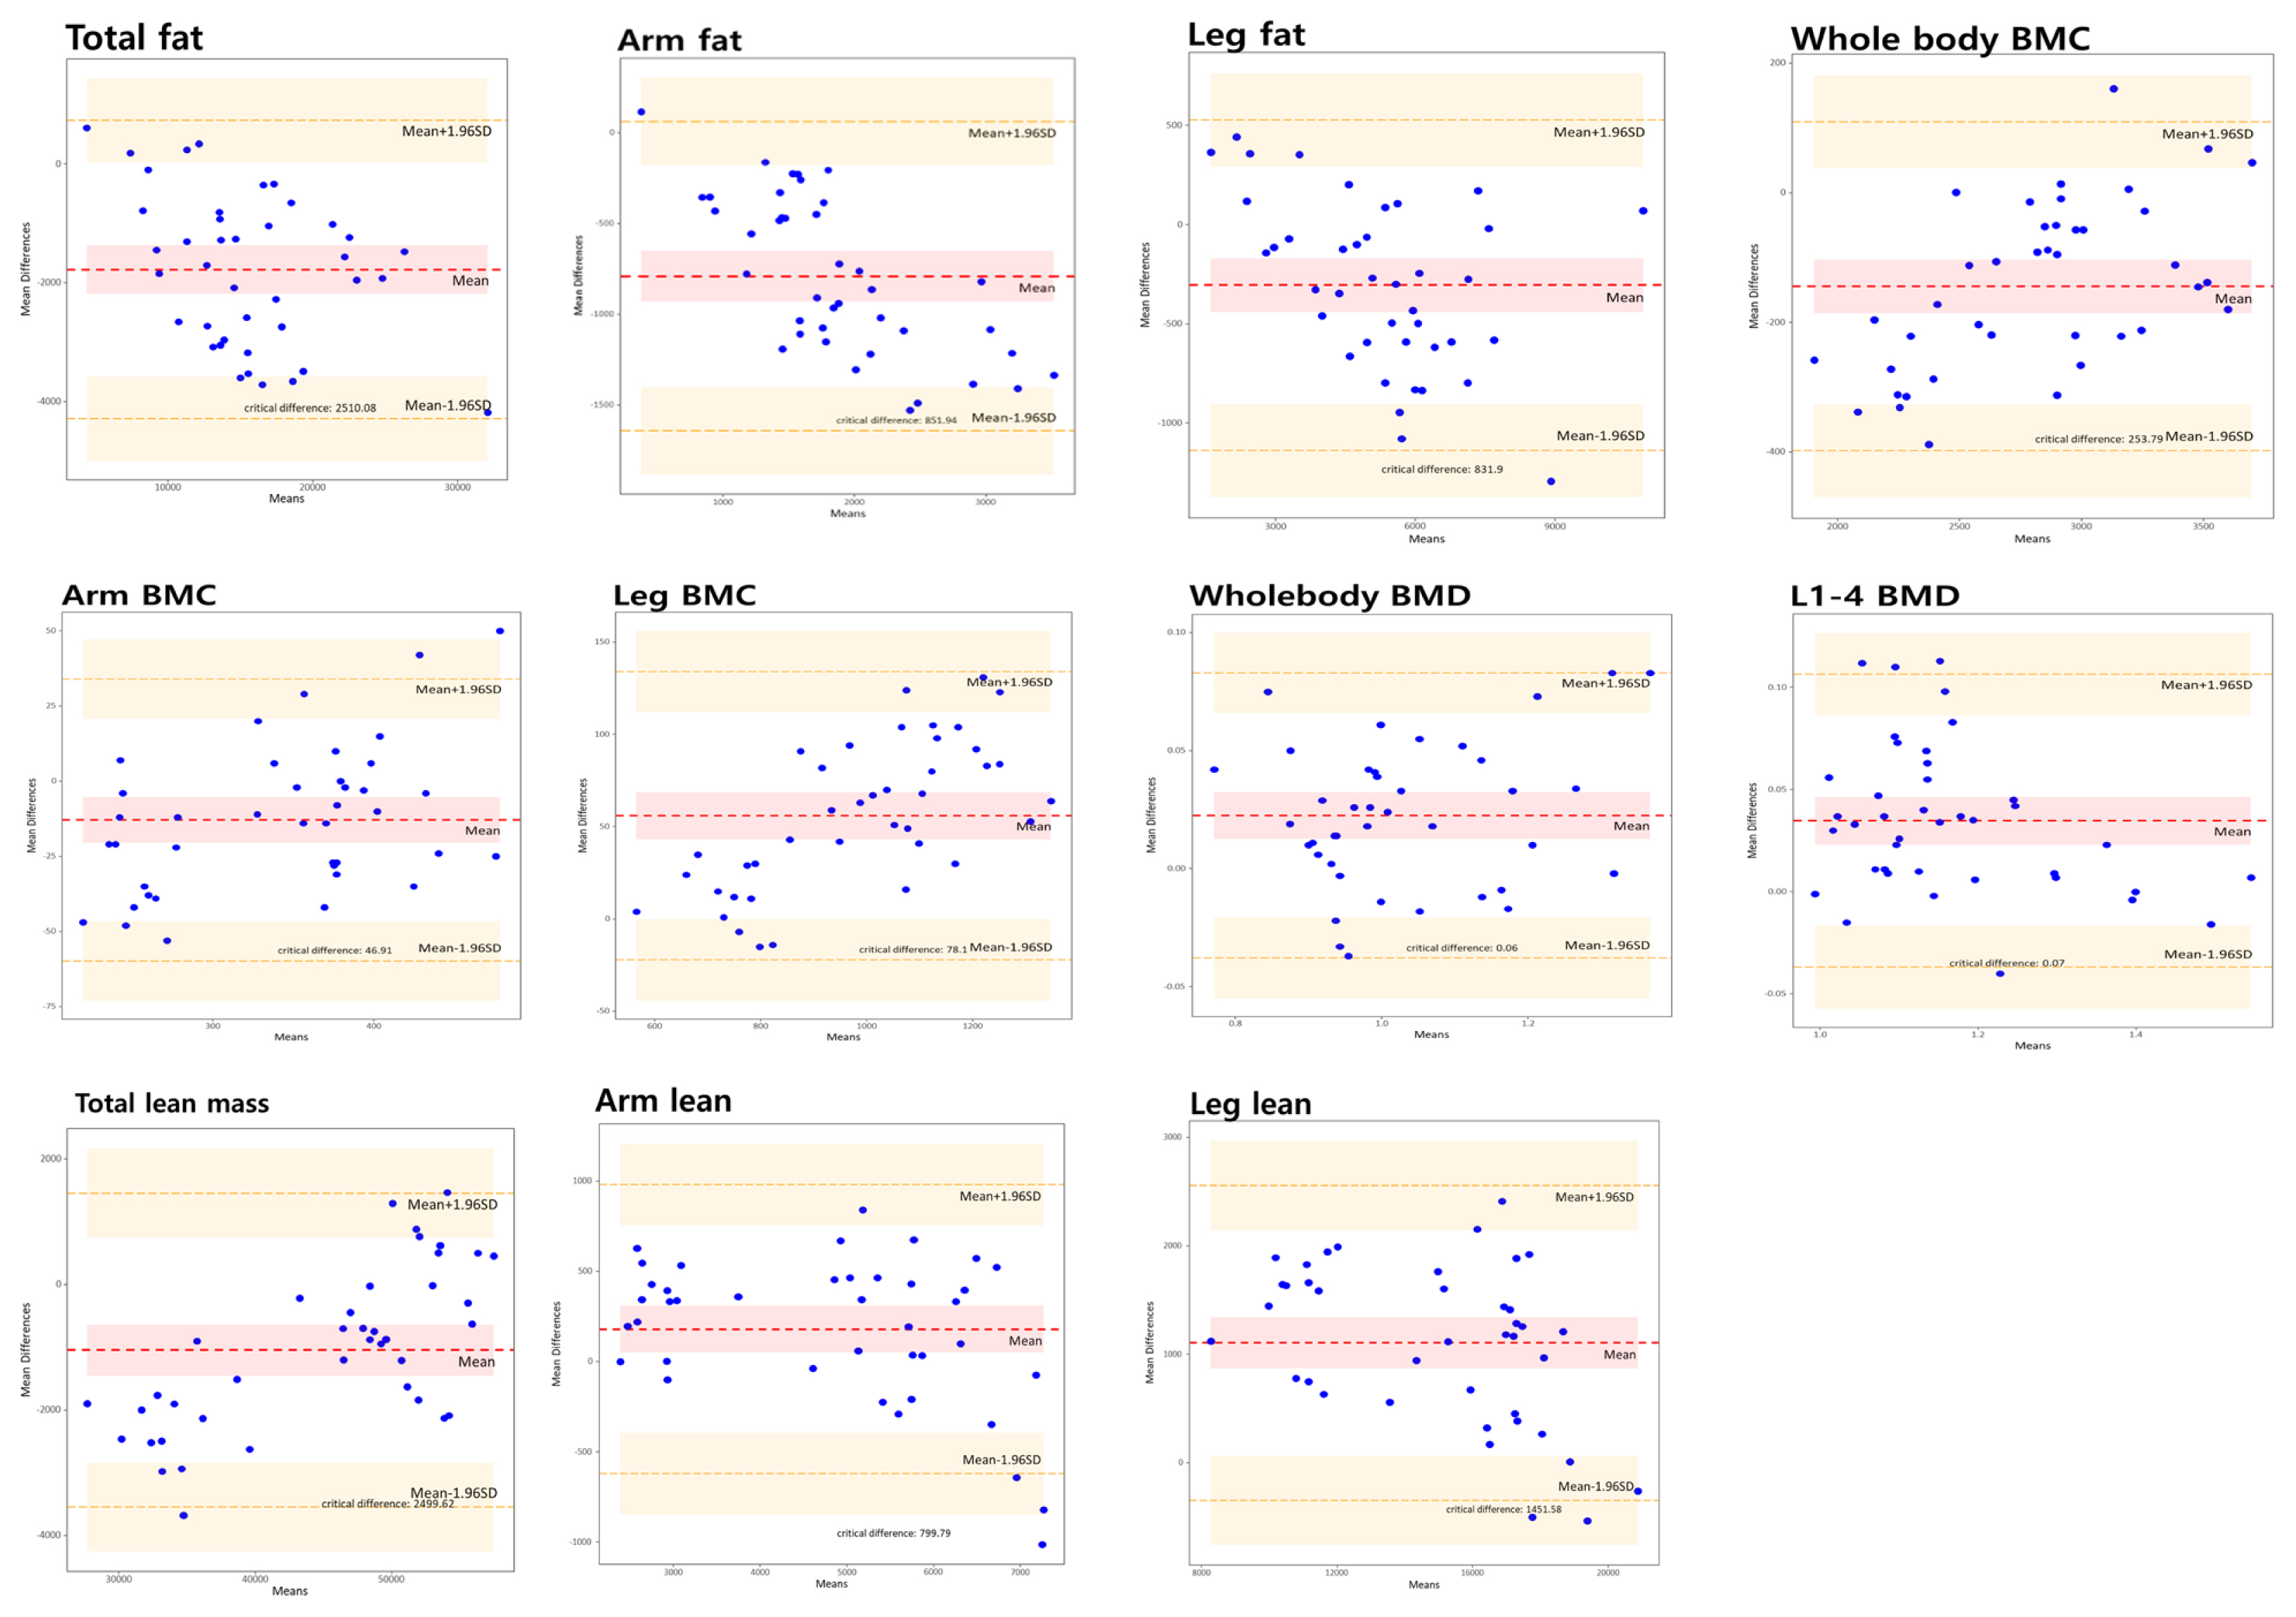
Bland and Altman plots of body composition and whole body bone mineral density (BMD) data between the Osteosys Primus and the GE Lunar Prodigy. BMC, bone mineral content.
Compared with the GE Lunar device, the mean Osteosys FM was overestimated to be 12.1% (1,776.9 g) in the whole body, 5.1% (163.85 g) in the gynoid, and 6.7% (87.15 g) in android. Compared with the GE Lunar device, the mean BMDs of the Osteosys Primus were underestimated at 5.4% (0.023 g/cm2) in the whole body and 7.2% (0.035 g/cm2) in L1-4. Compared with the GE Lunar device, mean lean mass of the Osteosys Primus were underestimated at 2.3% (1,045.3 g) in the total body, 3.8% (179.4 g) in arms, and 7.7% (1,104.8 g) in legs (Table 3). There were a strong correlation of BMD and body composition between both groups (Table 4 and Fig. 2). The Osteosys conversion formula using BMD and muscle mass from the GE Lunar is shown in Table 5. The GE Lunar conversion formula using BMD and muscle mass form Osteosys is shown in Table 6.
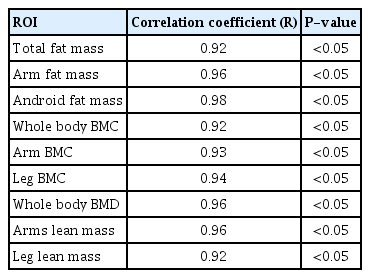
Correlation coefficient of body composition and whole body BMD data between 2 devices
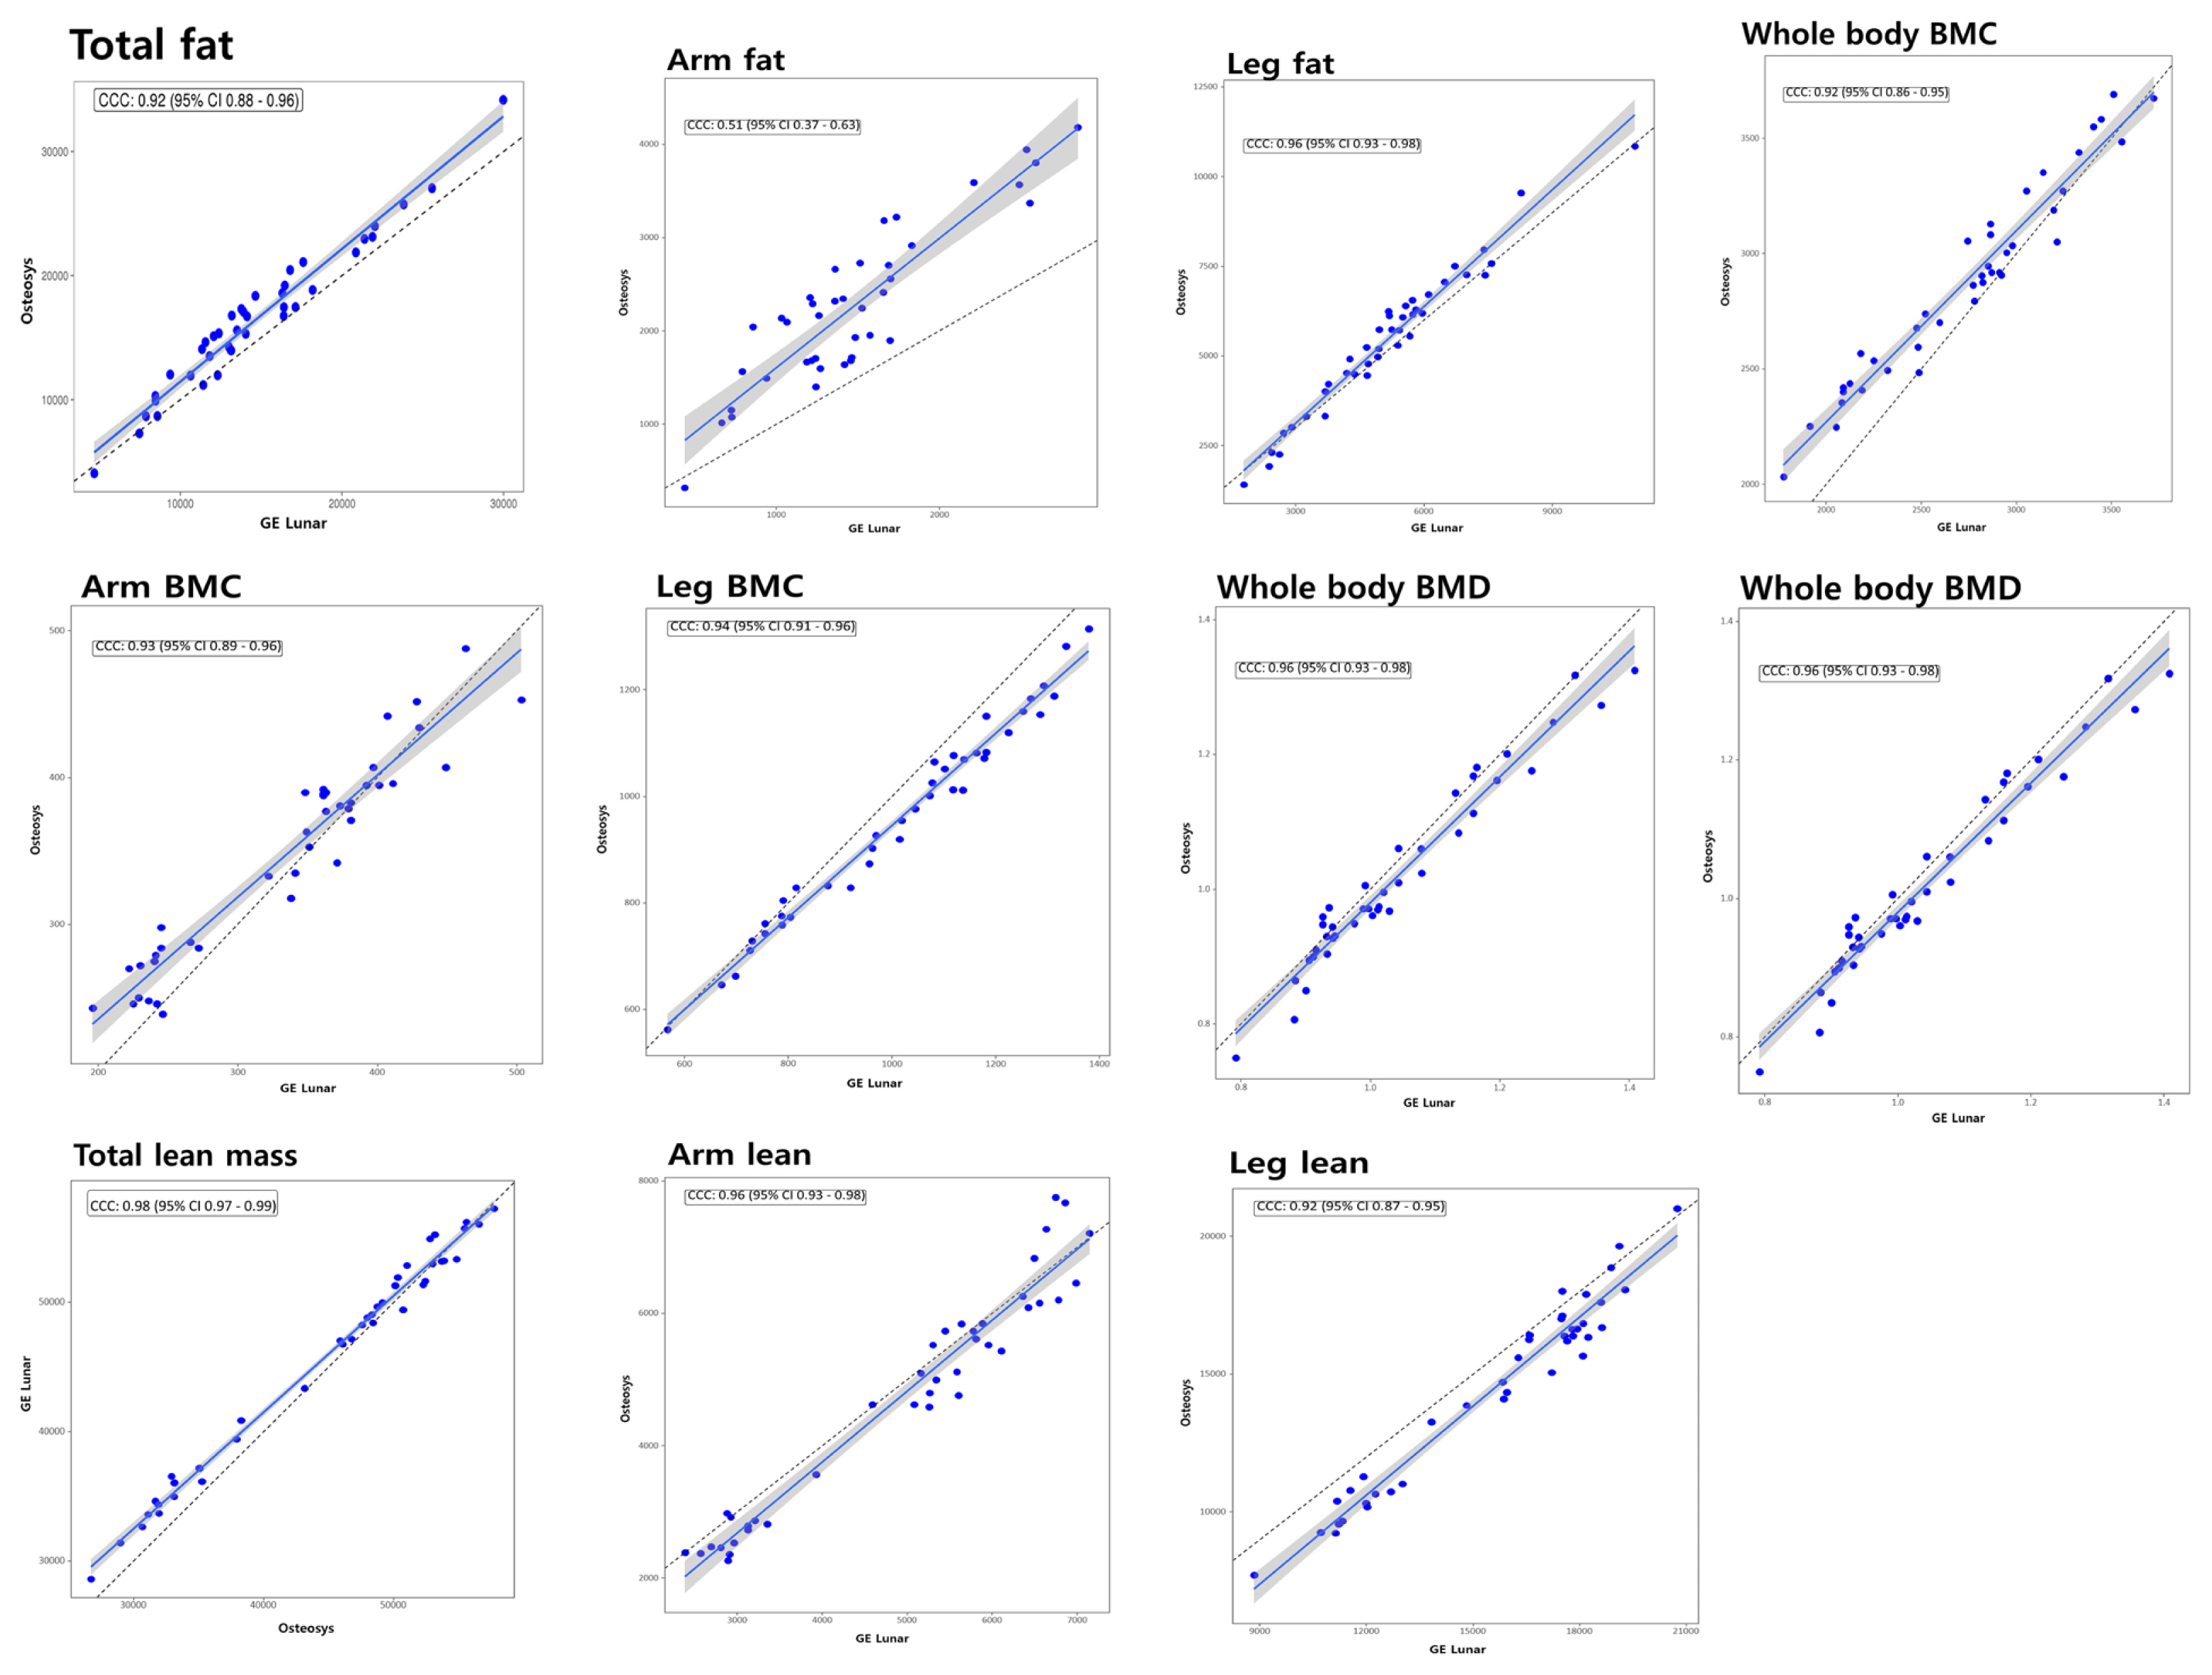
Correlation analysis of body composition and whole body bone mineral density (BMD) data between the 2 devices. BMC, bone mineral content.
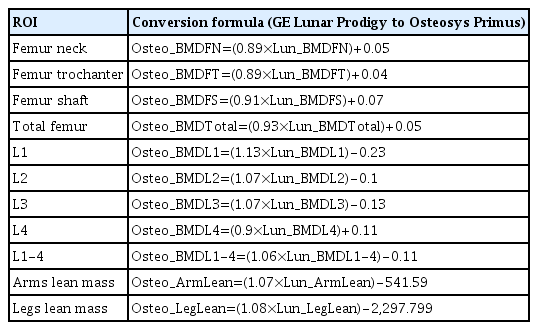
Conversion formula (GE Lunar Prodigy to Osteosys Primus)

Conversion formula (Osteosys Primus to GE Lunar Prodigy)
DISCUSSION
The principal finding of this study was a high correlation between the Osteosys Primus and the GE Lunar Prodigy. Whole-body FM and BMCs were significantly higher in Osteosys Primus. However, lean mass of the arms and legs and whole body BMDs were lower in Osteosys Primus. This is in agreement with the findings of the other cross-calibration studies and the BMD and BMC differences are consistent with the well-known differences in calibration between the manufacturers for measurements of hip and spine BMDs.[5,6,13,15]
So far, cross-calibration between DXA equipment for whole body BMDs and body composition measurements has been reported in only a few studies in the last decade.[5,6,13,15] Cross-calibration of body composition and entire body BMC and BMD between Hologic QDR-2000 (Hologic Inc., Bedford, MA, USA) and GE Lunar Prodigy found similar lean body mass (LBM) throughout the body.[13] However, FM and percent fat were significantly higher on the Hologic QDR-2000. The difference in calibration between the instruments might be related to the variation between the instruments, even those from the same manufacturer. The Lunar DPX-L (GE Healthcare) gave lower FM values than the iDXA and Prodigy in adults, with a corresponding greater increase in mean LBM values.[16] These findings correspond to our results. In this study, Osteosys Primus gave higher FM values than Lunar Prodigy in adults with lower mean LBM values. The reasons for the negative correlation of BMI and FM using the κ value were explained by Pearson et al. [13]. The κ value is the ratio of low-energy to high-energy attenuation coefficients in soft tissue, and as the ratio of fat increases in tissue, the attenuation of the beam’s high-energy component is lower than the low-energy component. Also, the difference in LBM has been negatively correlated with differences in FMs. That is, as the difference in LBM got bigger, the difference in FM fell.[13,15]
In an in vivo cross-calibration study, the BMD from Primus was consistently lower than that from Prodigy. So far, there has been no comparative cross-calibration study using humans.[17] Park et al. [17] assessed the accuracy and precision of 36 DXA devices from 3 manufacturers (10 Hologic, 16 Lunar, and 10 Osteosys) using the European Spine Phantom, in which the 3 vertebrae represent low (L1), medium (L2), and high (L3) densities, with actual BMD values of 0.496 g/cm2, 0.990 g/cm2, and 1.499 g/cm2, respectively. The average BMDs of L1, L2, and L3 in Osteosys Dexxum-T devices and the Lunar Prodigy device were 0.605 g/cm2 vs. 0.433 g/cm2 in L1, 1.072 g/cm2 vs. 0.928 g/cm2 in L2, and 1.574 g/cm2 vs. 1.424 g/cm2, respectively. The BMDs in Osteosys Dexxum-T devices were consistently lower than those from the Lunar Prodigy device.[17] Although this was a comparative study using EPS between different instruments, the findings corresponded with a previous study. According to cross-calibration studies, translational formulas for the Prodigy and Primus devices could be established and are described in Tables 5 and 6.
In this study, we compared the scan parameters between both devices. Using a higher voltage than GE Lunar, Osteosys Primus is designed to enable more precise measurements. Due to the small pixel size, more measurement time is required than GE Lunar equipment, but it has a higher resolution. Compared to the GE Lunar instrument, the exposure dose was not significantly different, despite the long measurement time.
This study had several limitations. First, it was the first study comparing Osteosys Primus and the GE Lunar Prodigy were included in the study. To generalize the results of this study to other races, further studies including Caucasians are needed.[18] Second, only a single total-body phantom was used for calibration. In future studies, whole-body phantom should be developed and used for accurate correction. Third, the sample size was too small. Further validation with large samples from different races will be required in the future.
In summary, there were a very high correlation of BMDs and muscle mass between the Osteosys Primus and the GE lunar prodigy. In addition, body compositions measured by Osteosys Primus were consistently lower than those of the GE Lunar prodigy by 2.4% to 7.7%. Th ere was a high agreement between all DXA systems in estimating BMCs and body compositions (R2=0.85–0.99). Nevertheless, cross-calibration equations should be used to examine data across systems to avoid erroneous conclusions.
In conclusion, linear correction equations were developed to ensure comparability of BMD and muscle mass between the Osteosys Primus and the GE Lunar Prodigy. Importantly, use of equations from previous studies would have increased the discrepancy between the Osteosys Primus and the GE Lunar Prodigy.
Notes
Funding
This work was supported by R&D Task (Development of Core Industrial Technology) funded by the Ministry of Trade, Industry and Energy (MOTIE, Korea) [R&D Project Number: 10079933].
Ethics approval and consent to participate
The study was approved by the Chung-Ang University Hospital Research Ethics Committee. Written informed consents were obtained from all participants and their legal guardians.
Authors’ contributions
Conceptualization: JIY and YCH; Data curation: JIY and YCH; Formal analysis: JIY and YCH; Validation: JIY and YCH; Writing–original draft preparation: JIY and YCH; Writing–review and editing: JIY and YCH; All authors read and approved the final manuscript.
Conflict of interest
No potential conflict of interest relevant to this article was reported.
This manuscript was posted on Research Square May 12, 2020 (DOI: 10.21203/rs.3.rs-25956/v1).