jbm > Volume 28(1); 2021 > Article
Yoon, Do Koh, Yoo, Kim, Lee, Park, and Ha: Does Bone Mineral Density Differ between Fan-Beam and Pencil-Beam?: A Meta-Analysis and Systemic Review

Abstract

Background

Dual energy X-ray absorptiometry (DXA) has evolved from pencil-beam (PB) to narrow fan-beam (FB) densitometers. We performed a meta-analysis of the available observational studies to determine how different modes of DXA affect bone mineral density (BMD) measurements.

Methods

A total of 1,233 patients (808 women) from 14 cohort studies were included. We evaluated the differences in BMD according to the DXA mode: PB and FB. Additionally, we evaluated the differences in BMD between the 2 types of FB mode: FB (Prodigy) and the most recent FB (iDXA). Pairwise meta-analysis was performed, and weighted mean differences (WMD) were calculated for (total lumbar, total hip, and total body).

Results

No significant difference was observed in total lumbar (pooled WMD, −0.013; P=0.152) and total hip BMD (pooled WMD, −0.01; P=0.889), between PB and FB. However, total body BMD was significantly lower in the PB compared to the FB group (pooled WMD, −0.014; P=0.024). No significant difference was observed in lumbar BMD (pooled WMD, −0.006; P=0.567), total hip (pooled WMD, −0.002; P=0.821), and total body (pooled WMD, 0.015; P=0.109), between Prodigy and iDXA.

Conclusions

The results of this study warrant the recommendation that correction equations should not be used when comparing BMD from different modes. Further research is still needed to highlight the ways in which differences between DXA systems can be minimized.

INTRODUCTION

Bone mineral density (BMD) is the primary determinant in the assessment of osteoporosis. Dual energy X-ray absorptiometry (DXA) is the most common modality for quantitative BMD.[1] It is a safe, accurate, and precise technique. Nevertheless, errors related to this exam are still very common and may significantly impact the final diagnosis and therapy.[2,3] Similar to other imaging modalities, DXA may be influenced by technical errors, and imaging artifacts may arise and accuracy and precision of the results may be influenced.[4]
Since its introduction in 1987, DXA has been improved over time, most evidently in reduced scan times.[5] Representatively, Pencil-beam (PB) DXA had been replaced with instruments that rely solely on fan-beam (FB) technology.[6,7] As the technology has developed, the focus of development has shifted to image quality, which has improved through advances in detector design, yielding a higher pixel density. A new detector and X-ray filter provide improved resolution and image quality by better bone edge detection.[8,9]
However, it has been verified that differences in BMD occur when PB DXA machines from the same and also from different manufacturers. Many cross-calibration studies have reported that systematic differences between the instruments may even exceed the annual biological BMD changes.[5,10-13] Considering the increased number of osteoporosis patients, it is important to determine whether and how DXA mode affect the BMD.
To the best of our knowledge, no meta-analysis has been published to determine if there are any systematic differences between 2 different modes of DXA scanner (FB and PB). Therefore, we performed a systematic review and meta-analysis of the available observational studies, evaluating the cross-calibration study difference between 2 different modes of DXA scanner, including the most recent model.

METHODS

1. Search methods for the identification of studies

This meta-analysis was conducted according to the updated guidelines of the Preferred Reporting Items for Systematic Review and Meta-Analysis Protocols (PRISMA-P). Two researchers (YBH, KYD) independently searched MEDLINE (PubMed), EMBASE, and Cochrane Library databases in September 2020. An overview of the search strategy is presented in Supplementary 1. Articles that met the selection criteria (not limited to randomized studies, including prospective and case-control studies) were included in the meta-analysis. We attempted to obtain complete data for the analysis by contacting the authors of articles with insufficient or missing data.

2. Study selection criteria

Studies were screened and selected by all investigators on the basis of a priori criteria. Inclusion criteria were as follows: (1) the study was a comparative that investigated the BMD of normal adults or adolescents who underwent DXA; (2) at least one of the following main clinical outcomes was reported: the mean of BMD and standard deviation (SD). We did not include European Spine Phantom as a population.
Exclusion criteria were as follows: (1) the study accessing patients using another device: including Q-computed tomography, ultrasonography, or multi-frequency bioelectrical impedance; (2) the study reported unavailable data including intraclass correlation coefficient, coefficient of variation (CV), and standard error of measurement; (3) the study used national registry data; and (4) the article was a review, expert opinion, case report, or basic science study.

3. Outcome measures and data extraction

The primary outcome for the meta-analysis was the difference of BMD in total lumbar, total hip, and total body, which were compared between several models. The analysis was done in the 2 groups; 1. FB vs. PB 2. FB vs. most recent FB.
For every eligible study, the following data were extracted and entered into a spreadsheet by 2 reviewers: the family name of the first author, year of publication, country, number of patients, device and program, sample characteristics (age, sex ratio, body mass index), and mean and SD in BMD (g/cm2). When BMD was measured at various sites, we included data from the sites where the highest values in each site were measured because these should best reflect. PB mode includes Lunar DPX-L (GE Healthcare, Madison, WI, USA), Lunar DPX-IQ (GE Healthcare), Hologic QDR-1000, and Hologic QDR-2000. FB mode includes Hologic QDR-4500A, Lunar Prodigy (GE Healthcare). Lunar iDXA systems (GE Healthcare) is classified as the most recent model.

4. Quality assessment and publication bias

Two of the authors (YBH, KYD) independently evaluated the quality of all studies, using the Newcastle-Ottawa Scales. This tool comprises three parameters: selection, comparability, and outcome. Each parameter consists of subcategorized items; selection has a maximum of 4 stars, comparability has a maximum of 2 stars, and exposure or outcome has 3 stars. We assessed the presence of publication bias using Begg’s funnel plot and Egger’s test.

5. Statistical analysis

The primary analysis (continuous outcomes) involved a pair-wise meta-analysis of the data from all relevant studies that reported the BMD data, and the studies were weighted according to the number of included patients The effect sizes were calculated as Hedges adjusted (g) weighted mean difference (WMD), which represents the magnitude of the difference between the comparative groups, for each outcome.[10] The WMD was computed separately for all available control and treatment groups in each study. All types of effect sizes were presented along with their 95% confidence intervals (CIs).
A fixed-effects or random-effects model was used to quantify the pooled effect size of the included studies, depending on the heterogeneity of the data. Heterogeneity between comparable studies was tested using χ2 and I2 tests; P>0.1 and I2<50%, respectively, were used as established criteria to determine statistical heterogeneity. All analyses were performed using STATA software (version 14.0; Stata Corp., College Station, TX, USA). This study was exempted from Institutional Review Board review since it did not involve any human subjects.

RESULTS

1. Description of the included studies

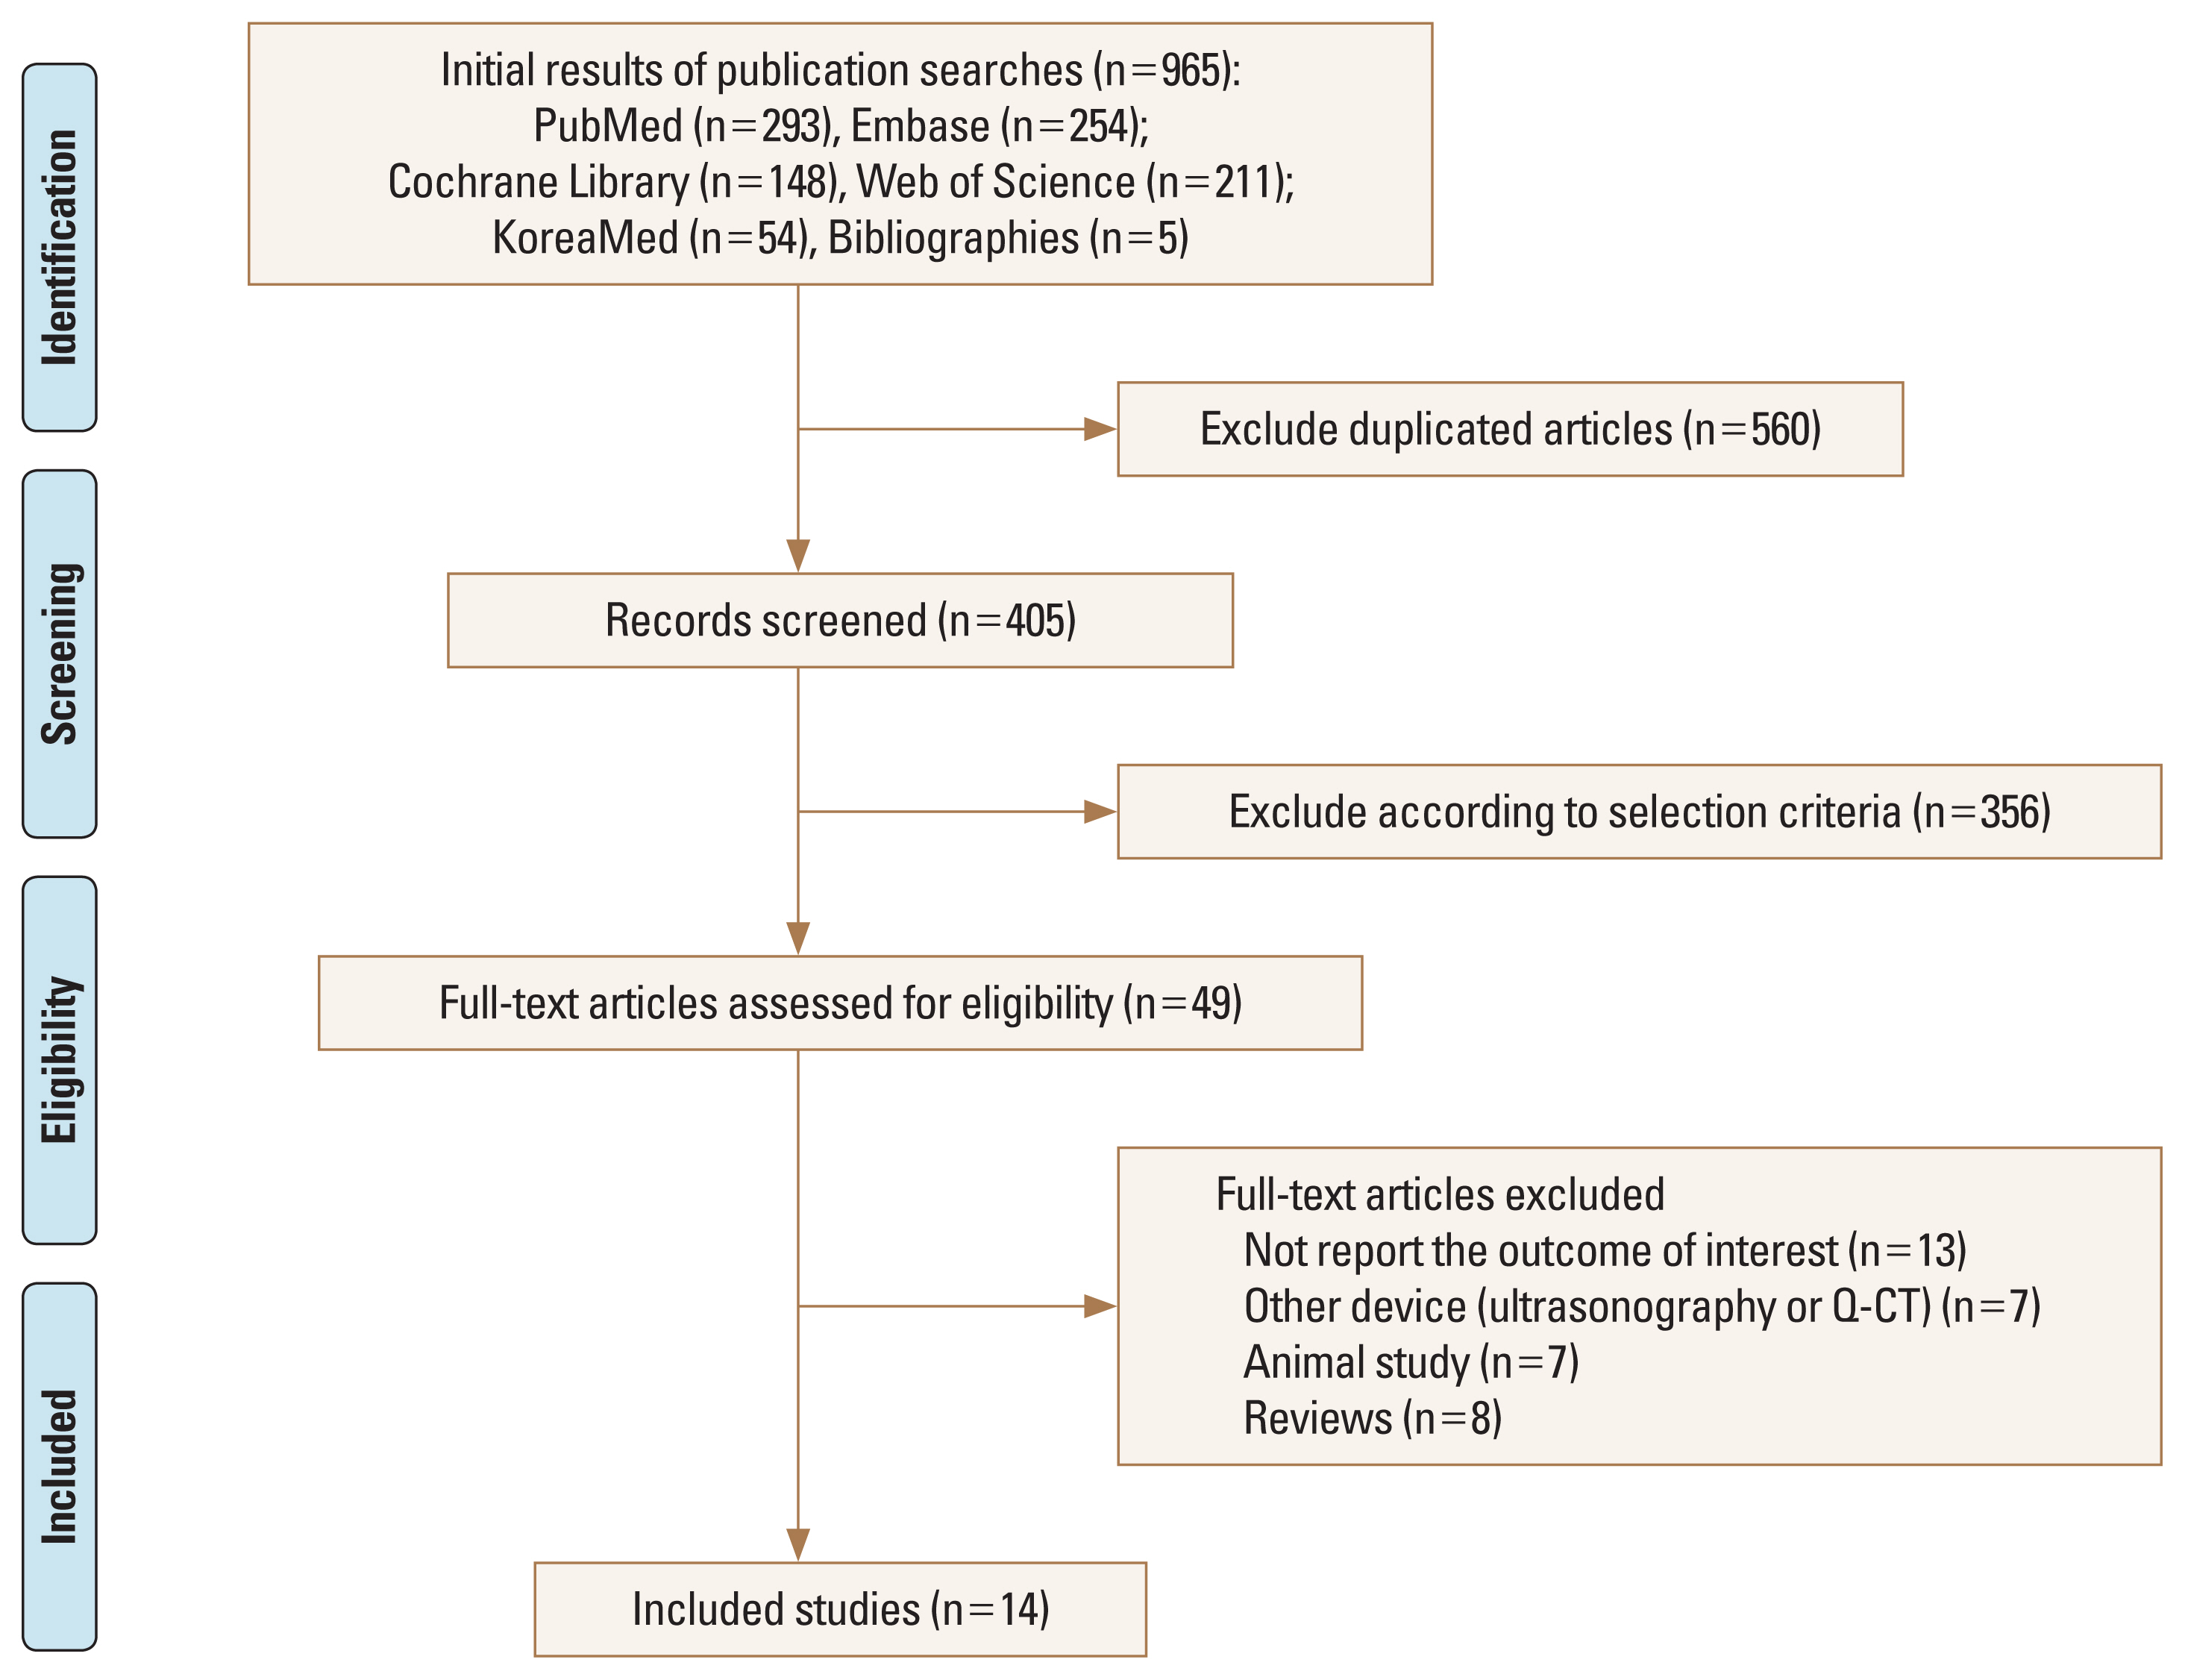
The primary search of the databases yielded 965 records. After duplicates were removed, 560 articles were screened by title and abstract. As a result, 49 full-text articles were selected and reviewed for eligibility. A total of 14 studies were finally included in the systematic review (Fig. 1).[14-27] The studies identified for the meta-analysis involved 1,233 participants, with women comprising 808 (65.5%) of the sample population. Among the 14 studies, 8 articles compared PB and FB modes and other 6 studies compared FB and most recent FB mode (Table 1).

2. PB vs. FB

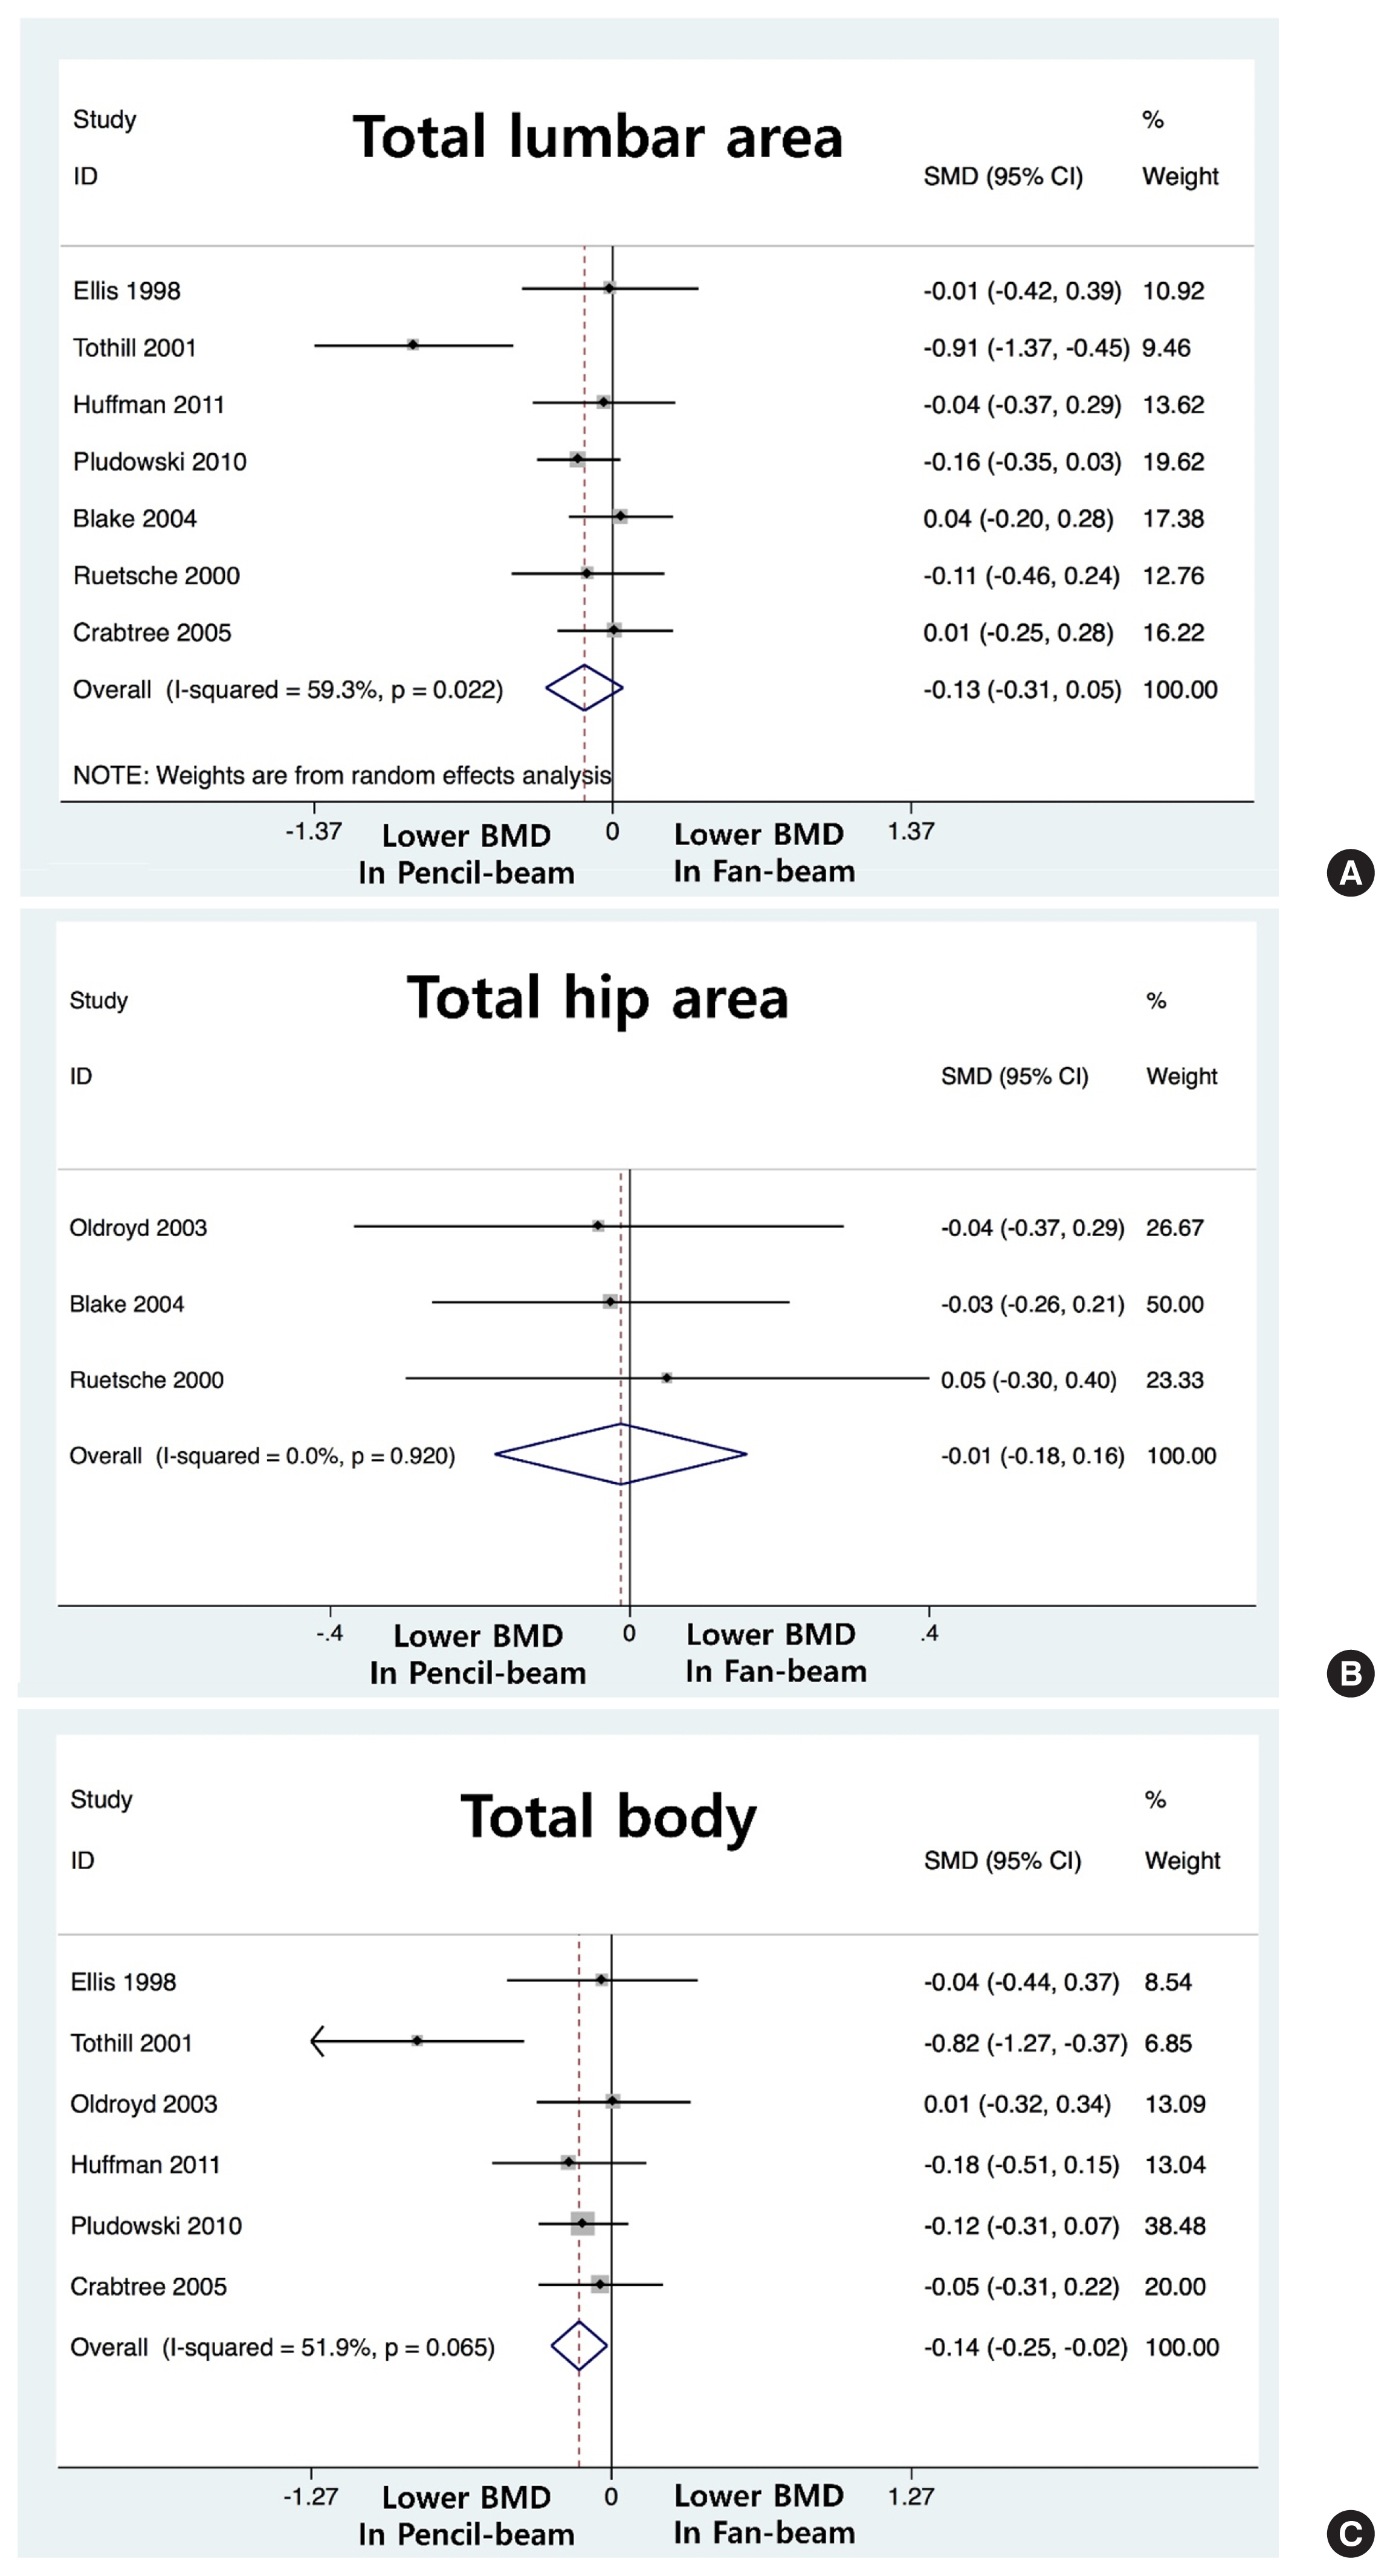
Eight studies, involving a total of 752 patients, reported data on BMD (Table 2).[18,20-26] In total lumbar BMD, there is no significant difference PB (Prodigy) and FB (pooled WMD, −0.013; 95% CI, −0.031 to 0.005; P=0.152) No significant difference also observed in total hip (pooled WMD, −0.01; 95% CI, −0.018 to 0.016; P=0.889). However, BMD was significantly lower in the PB group compared to those in the FB group in total body (pooled WMD, −0.014; 95% CI, −0.025 to −0.002; P=0.024) (Fig. 2).

3. FB vs. most recent FB

Six studies, involving a total of 481 patients, reported data on BMD.[14-17,19,27] In total lumbar BMD, there is no significant difference FB (Prodigy) and most recent FB (iDXA) (pooled WMD, −0.006; 95% CI, −0.026 to 0.014; P=0.567) No significant difference also observed in total hip (pooled WMD, −0.02; 95% CI, −0.017 to 0.14; P=0.821) and total body (pooled WMD, 0.015; 95% CI, −0.03 to 0.34; P=0.109) (Fig. 3).

4. Quality assessment and publication bias

In terms of the methodological quality, the mean value of the awarded stars was 6.5 (5 studies had 6 stars, 9 studies had 7 stars). The Begg’s funnel plot was not asymmetrical, and the P-values for bias were not significant for all outcomes (Fig. 4).

DISCUSSION

Each densitometer manufacturer uses its X-ray source and a specific methodology to obtain the 2 required energies.[22,28] Many previous studies investigating the agreement of BMD measurements between different modes of devices, but discrepancies exist among studies.[29,30] Thus, we want to investigate the continuity of the BMD calibration when a newer model replaces an older DXA scanner. In the present meta-analysis, we found no significant differences between the measured BMD regardless of the mode.
PB DXA is an established technique used for studies of bone mineral and body composition. PB technology has all but been replaced with FB systems due to faster scan times, improved image quality, and greater measurement precision.[22,31] The FB mode uses a greater photon flux and improved photon detection and consequently provides higher image resolution. Thus, FB DXA compared with PB DXA tended to overestimate BMD, whereas the area of both regions of interest was underestimated. Bone edge detection and exclusion of transverse processes through analysis probably play the key role. This discrepancy in bone edge detection represents a major explanation for BMD differences that can be found between the 2 modes.[29,32,33]
In the present study, the difference between PB and FB was only found in total BMD. It is suggested that a calibration offset was not responsible for the differences between 2 modes, as there was no significant difference in phantom scans.[7,34,35] The difference in BMD was probably owing in part to the significant difference in measured area between the 2 modes. The variation introduced by the relative position of each individual in the FB but not PB path owing to the height of the spine from the scanning table also can be more prominent in the total body area.[1,8,28, 31] And these differences between the FB and PB modes is more likely to be evident at low-density values than high-density value.[36,37]
The currently available GE Lunar system uses narrow-angle FB geometry. The excellent BMD correlation between iDXA and Prodigy is well-demonstrated in previous studies, but the inconsistencies of BMD between 2 machines are an ongoing issue.[14-16,35] The smaller pixel size further enhances the bone edge detection of iDXA, which stands out for small bones such as the hands and feet.[38] However, edge detection might be attenuated as the automated analysis techniques might place edges or regions of interest more in large bones. Further research in this field is needed for a clearer understanding of the underlying mechanism.[39]
The present study has several limitations. First, factors other than BMD, including accuracy or precision of different modes of DXA scanner have not been included in this meta-analysis. Second, we could not perform a sub-group analysis that women with osteoporosis who are known to be susceptible for erroneous to switch from one mode to another. Finally, there are numerous different brands of DXA scanners (Hologic Inc., Bedford, MA, USA) are available but our analysis was limited to 2 brands.

CONCLUSIONS

In conclusion, no significant difference of BMD was found between different modes of DXA scanner. To ensure high quality DXA acquisition and interpretation, further research is needed to highlight ways in which differences between DXA systems can be minimized.

Supplementary Information

DECLARATIONS

Funding

This work was supported by the Korea Medical Device Development Fund grant funded by the Korea government (the Ministry of Science and ICT, the Ministry of Trade, Industry and Energy, the Ministry of Health & Welfare, the Ministry of Food and Drug Safety) (NTIS Number: 9991007052).

Authors’ contributions

Conceptualization: Yoon BH, Koh YD, Yoo JI, Kim SJ, Lee GY, Park SB, Ha YC; Data curation: Yoon BH, Koh YD, Yoo JI, Kim SJ, Park SB, Ha YC; Formal analysis: Yoon BH, Koh YD, Yoo JI, Park SB, Ha YC; Investigation: Yoon BH, Koh YD, Yoo JI, Kim SJ, Lee GY, Park SB, Ha YC; Methodology: Yoon BH, Koh YD, Kim SJ, Lee GY, Park SB, Ha YC; Software: Yoon BH, Koh YD, Yoo JI, Lee GY, Park SB, Ha YC; Validation: Yoon BH, Koh YD, Lee GY, Park SB, Ha YC; Writing - original draft: Yoon BH, Koh YD, Yoo JI, Lee GY, Park SB, Ha YC; Writing - review & editing: Yoon BH, Koh YD, Yoo JI, Kim SJ, Park SB, Ha YC.

Ethics approval and consent to participate

This meta-analysis summaries previously published data and does not include new human data or tissue that require ethical approval and consent. The authors assume that the studies reviewed were conducted after ethical approval and consent, and in accordance with the Declaration of Helsinki.

Conflict of interest

Byung-Ho Yoon has been the associate editor of the Journal of Bone Metabolism since 2018. Yong-Chan Ha has been the editor-in-chief of the Journal of Bone Metabolism since 2017. No potential conflict of interest relevant to this article was reported.

Fig. 1
Preferred Reporting Items for Systematic Reviews and Meta-Analyses flow diagram details the process of relevant study selection.
jbm-2021-28-1-67f1.jpg
Fig. 2
Forest plots of the changes of bone mineral density (BMD) determined between pencil-beam mode and fan-beam mode: (A) Total lumbar area. (B) Total hip area. (C) Total body. Effect sizes are indicated as Hedges’ g weighted mean differences and 95% confidence interval (CI).
jbm-2021-28-1-67f2.jpg
Fig. 3
Forest plots of the changes of bone mineral density (BMD) determined between fan-beam (FB) mode (Prodigy) and most recent FB mode (iDXA): (A) Total lumbar area. (B) Total hip area. (C) Total body. Effect sizes are indicated as Hedges’ g weighted mean dif ferences and 95% confidence interval (CI).
jbm-2021-28-1-67f3.jpg
Fig. 4
Publication bias of included studies. SMD, standard mean difference.
jbm-2021-28-1-67f4.jpg
Table 1
Characteristics of included individual studies
References Year Country Type of DXA machine Sample size (female/total) Mean BMI (kg/m2) Mean age (yr)
Morrison et al.[16] 2016 UK Prodigy vs. iDXA 56/92 26.5 39.8
Watson et al.[14] 2017 UK Prodigy vs. iDXA 36/69 26.1 37.8
Saarelainen et al.[15] 2016 Finland Prodigy vs. iDXA 72/72 25.3 42.2
Hind et al.[27] 2015 UK Prodigy vs. iDXA 85 NA NA
Rhodes et al.[17] 2014 UK Prodigy vs. iDXA 43/63 25.6 45.1
Huffman et al.[20] 2005 UK DPX-L vs. Prodigy 34/72 25.9 35.9
Pludowski et al.[18] 2010 Poland DPX-L vs. Prodigy 97/212 1.2 10.8
Cho et al.[19] 2009 Korea Prodigy vs. iDXA 66/100 24.5 49.6
Crabtree et al.[21] 2005 UK DPX-L vs. Prodigy 58/110 NA NA
Blake et al.[22] 2004 UK DPX-L vs. Prodigy 104/135 26.8 57.1
Oldroyd et al.[23] 2003 UK DPX-L vs. Prodigy 44/72 21.6 32.9
Tothill et al.[24] 2001 UK QDR-1000W vs. QDR-4500A 24/41 NA 32.9
Ruetsche et al.[25] 2000 Switzerland QDR-2000W vs. QDR-4500A 63/63 29.3 48
Ellis and Shypailo [26] 1998 USA QDR-2000W vs. QDR-4500A 26/47 NA NA

DXA, dual energy X-ray absorptiometry; BMI, body mass index; NA, non-available.

Table 2
The mean value±standard deviation of bone mineral density in each included study
References Year N Lumbar total Total hip Total body


Pencil-beam Fan-beam Prodigy iDXA Pencil-beam Fan-beam Prodigy iDXA Pencil-beam Fan-beam Prodigy iDXA
Morrison et al.[16] 2016 92 0.99±0.1 1.05±0.14 - - 1.25±0.13 1.22±0.15

Watson et al.[14] 2017 69 1.25±0.15 1.26±0.15 1.08±0.16 1.08±0.15 1.25±0.16 1.24±0.15

Saarelainen et al.[15] 2016 72 1.16±0.14 1.18±0.14 0.99±0.12 1.00±0.12 - -

Hind et al.[27] 2015 85 1.22±0.14 1.21±0.15 1.05±0.15 1.05±0.15 - -

Rhodes et al.[17] 2014 63 1.16±0.15 1.12±0.14 - - 1.20±0.09 1.18±0.11

Huffman et al.[20] 2005 72 0.92±0.12 0.93±0.12 - - 1.16±0.12 1.19±0.13

Pludowski et al.[18] 2010 212 0.61±0.07 0.63±0.07

Choi et al.[19] 2009 100 1.06±1.18 1.04±1.18 0.93±0.16 0.94±0.16 0.80±0.04 0.80±0.04 - -

Crabtree et al.[21] 2005 110 0.64±0.08 0.64±0.09 - - 0.81±0.04 0.82±0.04

Blake et al.[22] 2004 135 1.00±0.21 0.99±0.21 0.84±0.16 0.84±0.15 - -

Oldroyd et al.[23] 2003 72 1.05±0.17 1.05±0.18 0.90±0.12 0.91±0.12 1.12±0.1 1.12±0.1

Tothill et al.[24] 2001 41 0.84±0.12 0.96±0.13 1.08±0.09 1.16±0.10

Ruetsche et al.[25] 2000 63 1.02±0.14 1.04±0.13 0.78±0.11 0.77±0.11 - -

Ellis and Shypailo [26] 1998 47 - - - - 0.94±0.19 0.94±0.17

REFERENCES

1. Baim S, Wilson CR, Lewiecki EM, et al. Precision assessment and radiation safety for dual-energy X-ray absorptiometry: position paper of the International Society for Clinical Densitometry. J Clin Densitom 2005;8:371-8. http://dx.doi.org/10.1385/jcd:8:4:371 .
pmid
2. Albano D, Agnollitto PM, Petrini M, et al. Operator-related errors and pitfalls in dual energy X-ray absorptiometry: how to recognize and avoid them. Acad Radiol 2020; http://dx.doi.og/10.1016/j.acra.2020.07.028 .
crossref
3. Watts NB. Fundamentals and pitfalls of bone densitometry using dual-energy X-ray absorptiometry (DXA). Osteoporos Int 2004;15:847-54. http://dx.doi.org/10.1007/s00198-004-1681-7 .
crossref pmid
4. Qutbi M, Soltanshahi M, Shiravand Y, et al. Technical and patient-related sources of error and artifacts in bone mineral densitometry using dual-energy X-ray absorptiometry: a pictorial review. Indian J Radiol Imaging 2020;30:362-71. http://dx.doi.org/10.4103/ijri.IJRI_495_19 .
crossref pmid pmc
5. Mészáros S, Berko P, Genti G, et al. Comparative evaluation of local and international reference databases for forearm densitometry: different impacts on diagnostic decisions. J Clin Densitom 2006;9:445-53. http://dx.doi.org/10.1016/j.jocd.2006.06.004 .
crossref pmid
6. Mueller B, O’Connor MK. Effects of radioisotopes on the accuracy of dual-energy X-ray absorptiometry for bone densitometry. J Clin Densitom 2002;5:283-7. http://dx.doi.org/10.1385/jcd:5:3:283 .
crossref pmid
7. Glüer CC. 30 years of DXA technology innovations. Bone 2017;104:7-12. http://dx.doi.org/10.1016/j.bone.2017.05.020 .
crossref pmid
8. Michaeli DA, Mirshahi A, Singer J, et al. A new X-ray based osteoporosis screening tool provides accurate and precise assessment of phalanx bone mineral content. J Clin Densitom 1999;2:23-30. http://dx.doi.org/10.1385/jcd:2:1:23 .
crossref pmid
9. Kröger H, Reeve J. Diagnosis of osteoporosis in clinical practice. Ann Med 1998;30:278-87. http://dx.doi.org/10.3109/07853899809005856 .
crossref pmid
10. Denissen H, Montanari C, Martinetti R, et al. Alveolar bone response to submerged bisphosphonate-complexed hydroxyapatite implants. J Periodontol 2000;71:279-86. http://dx.doi.org/10.1902/jop.2000.71.2.279 .
crossref pmid
11. Prins SH, Jørgensen HL, Jørgensen LV, et al. The role of quantitative ultrasound in the assessment of bone: a review. Clin Physiol 1998;18:3-17. http://dx.doi.org/10.1046/j.1365-2281.1998.00067.x .
crossref pmid
12. Koizumi K, Uchiyama G, Araki T, et al. Fundamental evaluation of bone densitometry using dual energy X-ray absorptiometry (DEXA). Nihon Igaku Hoshasen Gakkai Zasshi 1990;50:123-9.
pmid
13. Koo BS, Yoon BH. Characteristics of appendicular tissue components in patients with rheumatoid arthritis. J Bone Metab 2020;27:35-42. http://dx.doi.org/10.11005/jbm.2020.27.1.35 .
crossref pmid pmc
14. Watson LPE, Venables MC, Murgatroyd PR. An investigation into the differences in bone density and body composition measurements between 2 GE lunar densitometers and their comparison to a 4-component model. J Clin Densitom 2017;20:498-506. http://dx.doi.org/10.1016/j.jocd.2017.06.029 .
crossref pmid
15. Saarelainen J, Hakulinen M, Rikkonen T, et al. Cross-calibration of GE healthcare lunar prodigy and iDXA dual-energy X-ray densitometers for bone mineral measurements. J Osteoporos 2016;2016:1424582. http://dx.doi.org/10.1155/2016/1424582 .
crossref
16. Morrison SA, Petri RM, Hunter HL, et al. Comparison of the lunar prodigy and iDXA dual-energy X-ray absorptiometers for assessing total and regional body composition. J Clin Densitom 2016;19:290-7. http://dx.doi.org/10.1016/j.jocd.2015.06.003 .
crossref pmid
17. Rhodes LA, Cooper W, Oldroyd B, et al. Cross-calibration of a GE iDXA and prodigy for total and regional body bone parameters: the importance of using cross-calibration equations for longitudinal monitoring after a system upgrade. J Clin Densitom 2014;17:496-504. http://dx.doi.org/10.1016/j.jocd.2013.09.009 .
crossref pmid
18. Pludowski P, Jaworski M, Matusik H, et al. The evaluation of consistency between body composition assessments in pediatric population using pencil beam and fan beam dual-energy x-ray absorptiometers. J Clin Densitom 2010;13:84-95. http://dx.doi.org/10.1016/j.jocd.2009.11.001 .
crossref pmid
19. Choi YJ, Lee BJ, Lim HC, et al. Cross-calibration of iDXA and Prodigy on spine and femur scans in Korean adults. J Clin Densitom 2009;12:450-5. http://dx.doi.org/10.1016/j.jocd.2009.08.001 .
crossref pmid
20. Huffman DM, Landy NM, Potter E, et al. Comparison of the lunar DPX-L and prodigy dual-energy X-ray absorptiometers for assessing total and regional body composition. Int J Body Compos Res 2005;3:25-30.
pmid pmc
21. Crabtree NJ, Shaw NJ, Boivin CM, et al. Pediatric in vivo cross-calibration between the GE Lunar Prodigy and DPX-L bone densitometers. Osteoporos Int 2005;16:2157-67. http://dx.doi.org/10.1007/s00198-005-2021-2 .
crossref pmid
22. Blake GM, Harrison EJ, Adams JE. Dual X-ray absorptiometry: cross-calibration of a new fan-beam system. Calcif Tissue Int 2004;75:7-14. http://dx.doi.org/10.1007/s00223-004-0169-y .
crossref pmid
23. Oldroyd B, Smith AH, Truscott JG. Cross-calibration of GE/Lunar pencil and fan-beam dual energy densitometers--bone mineral density and body composition studies. Eur J Clin Nutr 2003;57:977-87. http://dx.doi.org/10.1038/sj.ejcn.1601633 .
crossref
24. Tothill P, Hannan WJ, Wilkinson S. Comparisons between a pencil beam and two fan beam dual energy X-ray absorptiometers used for measuring total body bone and soft tissue. Br J Radiol 2001;74:166-76. http://dx.doi.org/10.1259/bjr.74.878.740166 .
crossref pmid
25. Ruetsche AG, Lippuner K, Jaeger P, et al. Differences between dual X-ray absorptiometry using pencil beam and fan beam modes and their determinants in vivo and in vitro. J Clin Densitom 2000;3:157-66. http://dx.doi.org/10.1385/jcd:3:2:157 .
crossref pmid
26. Ellis KJ, Shypailo RJ. Bone mineral and body composition measurements: cross-calibration of pencil-beam and fan-beam dual-energy X-ray absorptiometers. J Bone Miner Res 1998;13:1613-8. http://dx.doi.org/10.1359/jbmr.1998.13.10.1613 .
crossref pmid
27. Hind K, Cooper W, Oldroyd B, et al. A cross-calibration study of the GE-Lunar iDXA and prodigy for the assessment of lumbar spine and total hip bone parameters via three statistical methods. J Clin Densitom 2015;18:86-92. http://dx.doi.org/10.1016/j.jocd.2013.09.011 .
crossref pmid
28. Blake GM, Knapp KM, Fogelman I. Dual X-ray absorptiometry: clinical evaluation of a new cone-beam system. Calcif Tissue Int 2005;76:113-20. http://dx.doi.org/10.1007/s00223-004-0080-6 .
pmid
29. Yang DZ, Shang JY, Song WZ, et al. Manufacture and evaluation of a spine phantom used in the cross-calibration of DXA bone densitometry. Zhongguo Yi Xue Ke Xue Yuan Xue Bao 2003;25:262-6.
pmid
30. Young JT, Carter K, Marion MS, et al. A simple method of computing hip axis length using fan-beam densitometry and anthropometric measurements. J Clin Densitom 2000;3:325-31. http://dx.doi.org/10.1385/jcd:3:4:325 .
crossref pmid
31. Mazess RB, Hanson JA, Payne R, et al. Axial and total-body bone densitometry using a narrow-angle fan-beam. Osteoporos Int 2000;11:158-66. http://dx.doi.org/10.1007/pl00004178 .
crossref pmid
32. Lapillonne A, Salle BL. Methods for measuring body composition in newborns--a comparative analysis. J Pediatr Endocrinol Metab 1999;12:125-37. http://dx.doi.org/10.1515/jpem.1999.12.2.125 .
pmid
33. Yoon BH, Kim KC. Does teriparatide improve fracture union?: A systematic review. J Bone Metab 2020;27:167-74. http://dx.doi.org/10.11005/jbm.2020.27.3.167 .
crossref pmid pmc
34. Morgan SL, Krueger D, Bassler J, et al. Effect of very dense artifacts on Hologic and general electric bone densitometry results. Arch Osteoporos 2020;15:77. http://dx.doi.org/10.1007/s11657-020-00742-3 .
crossref pmid
35. Krueger D, Vallarta-Ast N, Checovich M, et al. BMD measurement and precision: a comparison of GE Lunar Prodigy and iDXA densitometers. J Clin Densitom 2012;15:21-5. http://dx.doi.org/10.1016/j.jocd.2011.08.003 .
crossref pmid
36. Haïat G, Padilla F, Barkmann R, et al. In vitro speed of sound measurement at intact human femur specimens. Ultrasound Med Biol 2005;31:987-96. http://dx.doi.org/10.1016/j.ultrasmedbio.2005.02.015 .
crossref pmid
37. Baltas CS, Balanika AP, Raptou PD, et al. Clinical practice guidelines proposed by the Hellenic Foundation of Osteoporosis for the management of osteoporosis based on DXA results. J Musculoskelet Neuronal Interact 2005;5:388-92.
pmid
38. Hind K, Oldroyd B. Incidental findings with cross calibration of the GE prodigy and iDXA densitometers. J Clin Densitom 2015;18:561-3. http://dx.doi.org/10.1016/j.jocd.2013.07.002 .
crossref pmid
39. Hind K, Oldroyd B, Truscott JG. In vivo precision of the GE Lunar iDXA densitometer for the measurement of total-body, lumbar spine, and femoral bone mineral density in adults. J Clin Densitom 2010;13:413-7. http://dx.doi.org/10.1016/j.jocd.2010.06.002 .
crossref pmid


ABOUT
ARTICLE CATEGORY

Browse all articles >

BROWSE ARTICLES
EDITORIAL POLICY
FOR CONTRIBUTORS
Editorial Office
#1001, Hyundai Kirim Officetel, 42 Seocho-daero 78-gil, Seocho-gu, Seoul 06626, Korea
Tel: +82-2-3473-2231    Fax: +82-70-4156-2230    E-mail: editors.jbm@gmail.com                

Copyright © 2024 by The Korean Society for Bone and Mineral Research.

Developed in M2PI

Close layer
prev next