Association of Arterial Stiffness and Osteoporosis in Healthy Men Undergoing Screening Medical Examination
Article information
Abstract
Background
Association of arterial stiffness and osteoporosis has been previously reported in women. However, this association is still controversial for men. Therefore, we investigated correlation of arterial stiffness and osteoporosis by measuring brachial-ankle (ba) pulse wave velocity (PWV) and bone mineral density (BMD).
Methods
We reviewed medical charts of 239 people (women: 128, men: 111) who visited the Health Promotion Center, retrospectively. ba-PWV was measured by automatic wave analyzer. Lumbar spine (L1-L4) BMD and femur BMD were measured by dual energy X-ray absorptiometry. Metabolic syndrome was based on the National Cholesterol Education Program (NCEP)-Adult Treatment Panel (ATPIII) definition. Body mass index (BMI)>25 kg/m2 was used instead of waist circumference.
Results
In Pearson's correlation analysis, PWV and femur BMD (Neck, total) had a significant inverse relationship in men (r=-0.254, P=0.007; r=-0.202, P=0.034). In women, PWV and the L-spine, femur (Neck, total) had a significant inverse relationship. (r=-0.321, P<0.001; r=-0.189, P=0.032; r=-0.177, P=0.046) Age and PWV showed the greatest association in both men and women (r=0.46 P<0.001; r=0.525, P<0.001) In multiple regression analysis, the L-spine BMD and PWV had an independent relationship in women after adjusting for age, metabolic syndrome, BMI, smoking, drinking and exercise. (r=-0.229, P=0.015). No independent association was found between PWV and BMD in men.
Conclusions
The association between arterial stiffness and BMD was confirmed in women. However, this association was not statistically significant for men.
INTRODUCTION
Cardiovascular disease (CVD) and osteoporosis is one of the major factors for mortality and morbidity in elderly population. The prevalence is known to be increasing with age, but recently there were a number of studies reported that both of the diseases are independent to age. Especially the correlation between cardiovascular death and bone density were observed in menopausal women.[1,2] Coronary artery disease increased with decrease in bone density[3,4] and vascular calcification was progressed with osteopenia.[5,6,7] In a prospective cohort study conducted in China showed correlation between bone density, osteopenia and CVD both in men and women.[8] However, in Rotterdam study, the correlation between low bone density and peripheral vascular disease was investigated with ankle-brachial index and there was no correlation in men which differed to the results in women.[9]
There are studies being conducted about the correlation between arterial stiffness and osteoporosis.[10,11,12] Pulse wave velocity (PWV), central blood pressure (BP) and Augmentation Index (AI) are used for the measurement of arterial stiffness, and amongst those PWV is the most widely used non-invasive examination method with low cost and simple. The measurement of arterial stiffness helps to make decisions on prediction of risk of CVD prevalence, and the effectiveness of the treatments.
Brachial-ankle (ba) PWV which records sphygmograph with ocillometry sensor with an attachment of BP measuring cuff on brachial and ankle area, and it does not require advanced technique, and does not expose groin, hence it is used widely in the clinical practice. Recently a report was announced that ba-PWV is identical to carotid-femoral PWV,[13,14] and although there are only a few studies relative to carotid-femoral PWV, it has been shown to be useful in prediction of cardiovascular death in CVD, renal failure, heart failure patients.[15,16,17] Vascular calcification may cause arterial stiffness and PWV and vascular calcification are the reflection of arteriosclerosis.
The correlation between the risk factors of CVD and CVD such as arteriosclerosis, arterial stiffness and osteoporosis are not clear yet, and the results are inconsistent. Therefore we aimed to investigate on correlation between arterial stiffness and BMD of Lumbar spine, femur by using ba-PWV, especially the difference in gender.
METHODS
1. Study subjects
Medical screening conducted between a period of May 2009 to December 2012 at tertiary hospitals were retrospectively analyzed for 239 female and male subjects. Records of doctor's consultation were referenced for lifestyle, medical history, medication history, smoking and alcohol intake. Weight and height were measured on a height-weight scale without shoes and outer clothes, and body mass index (BMI) was calculated with weight (kg) and height (m2). All the patient had a basic regular examination for blood test, ba-PWV, Dual energy X-ray absorptiometry (DXA) spine, femur. The blood test was conducted after longer than 12 hours of fasting and BP was taken on the right arm with an electronic BP measure after the resting for longer than 10 minutes.
After the review on adult health screening charts, the following patients were excluded from the study; history of hypertension, diabetes, dyslipidemia, chronic renal failure, thyroid disease, parathyroid disease, rheumatoid arthritis, history of taking steroids, diagnosed with cancer within the past 5 years, gonad dysfunction, patient taking hormonal agents.
2. Study methods
BMD was measured with DXA (Lunar Prodigy Advance, GE Lunar, Medison, WI, USA) at L1-L4, neck and total body. The results was interpreted in g/cm2.
PWV was measured with automatic waveform analyzer (VP-1000; Nippon Colin Ltd., Komaki, Japan) after the patient rested for 10 minutes supine position. For BP of both arms and ankles, brachial artery and posterior tibial artery were measured with oscillometry method, and ba index was automatically calculated. Right and left ba-PWVs were measured simultaneously. In this study, the mean value of both ba-PWV was used.
In terms of smoking history, current smoker and non-smoker/ex-smoker were classified into smoking group and non-smoker group, respectively, and in terms of alcohol intake, alcohol risk group was consisted with people who drink more than 1.5 bottle per week and non-alcohol group was consisted with people who drink under 1.5 bottle per week. The standard for an exercise group was exercise for 30 minutes or longer more than 3 times per week and people who exercise less than 3 times per week or less than 30 minutes per day were classified into non-exercise group.
In terms of metabolic syndrome, National Cholesterol Education Program (NCEP)-Adult Treatment Panel (ATPIII) and the World Health Organization (WHO) guideline of obesity standards for Asia Pacific Region 2000 were combine and BMI of greater than 25 kg/m2 was used instead of waist circumference,[18] and also the blood test conducted at the health screening was included. The presence of metabolic syndrome was defined when a patient met 3 or more diagnostic criteria. 1) BMI: ≥25 kg/m2, 2) triglyceride (TG): ≥150 mg/dL, 3) high-density lipoproteins (HDL): ≤40 mg/dL (male), 4) fetal bovine serum (FBS): ≥100 mg/dL, 5) BP: ≥130/85 mmHg.
3. Statistical analysis
All the variables were presented in mean±standard deviation. The difference in PWV was analyzed in terms of the presence of metabolic syndrome, smoking, alcohol, presence of routine exercise with independent t-test, and the correlation between PWV and age, BMI and BMD in different areas was analyzed with Pearson's correlation analysis.
Through independent t-test and Pearson's correlation analysis, a multiple regression analysis was conducted on statistically significant variables as covariales and PWV as dependent variables. Especially, variables (smoking, alcohol intake, exercise, metabolic syndrome) which were not statistically significant (P>0.05) but could be confounding factors were also included as covariales and multiple regression analysis was conducted. Statistical significance was defined when P value was less than 0.05, and all statistical analysis used SPSS version 12.0 (SPSS Inc., Chicago, IL, USA).
RESULTS
1. Analysis of the difference in basic examination category by gender
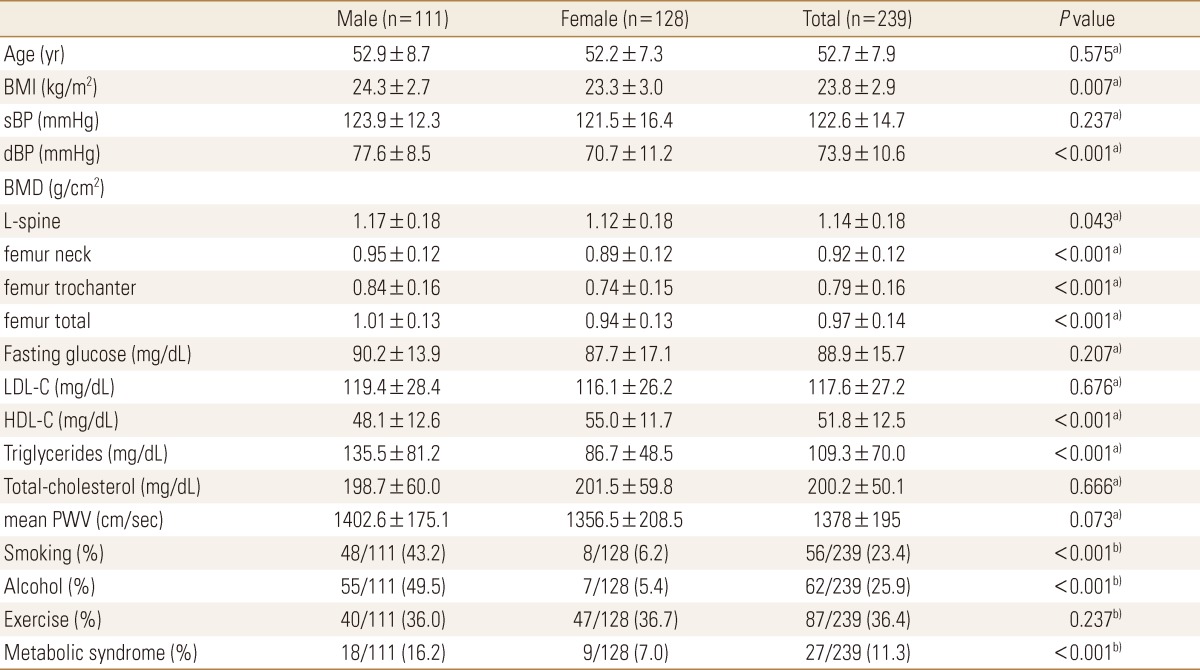
There were 128 female and 111 male subjects (total 239 subjects) and their mean age was 53 years old, and BMI was 24 kg/m2 in male, 23 kg/m2 in female, which was higher in male. BMD in all the areas were high in male. TG, metabolic syndrome, smoking ratio was significantly high in male, and HDL was significantly higher in female (P<0.001). Mean PWV was higher in male, but there was no significant difference. (1,402.6±175.1 cm/sec vs. 1,356.5±208.5 cm/sec; P=0.073)(Table 1).
2. Analysis and distribution of correlation between BMD and age
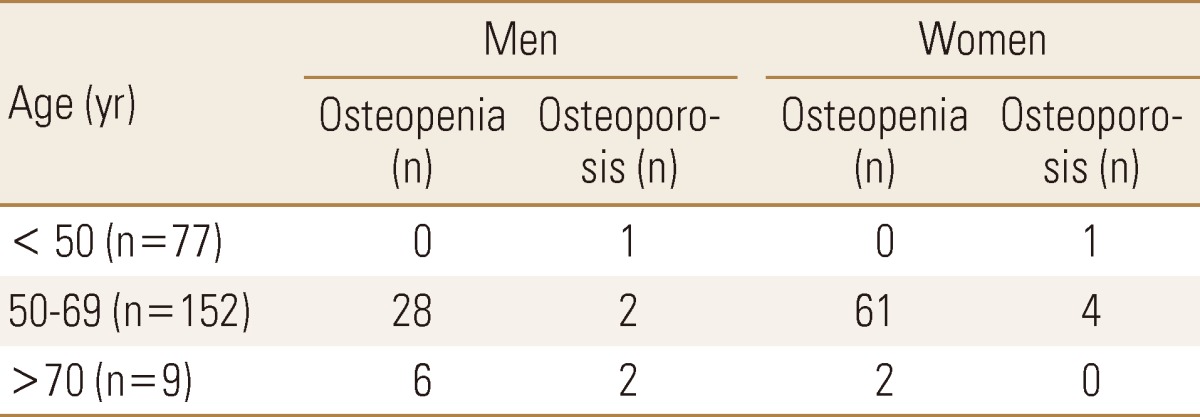
The results from the analysis in terms of age, in male subjects BMD of coxal articulation neck and age showed negative correlation (r=-0.308, P=0.001), but there was no statistically significant correlation between age and BMD of whole coxal articulation (r=-0.183, P=0.054), BMD of coxal articulation intertrochanter (r=0.045, P=0.636) and BMD of waist (r=-0.107, P=0.263). In female subjects there was significant negative correlation between age and BMD of lumbar (r=-0.293, P=0.001), coxal articulation neck (r=-0.357, P<0.001), and whole coxal articulation (r=-0.258, P=0.003), but no statistically significant correlation between age and BMD of coxal articulation intertrochanter (r=-0.117, P=0.188) (Table is not shown). Osteopenia and osteoporosis distribution in male and female according to age was presented in Table 2 and the BMD results were presented as scatter plot (Fig. 1) according to their age.
3. Correlation analysis and independent t-test on the PWV and variables in male and female
As the results of independent t-test in male, there was no difference in PWV value according to smoking, alcohol intake, and exercise. (P=0.813, P=0.689, P=0.458). Also as results of independent t-test in female, there was no difference in PWV value according to smoking, alcohol intake, and exercise. (P=0.152, P=0.720, P=0.327)
In male, the group with metabolic syndrome had higher PWV value than the group without metabolic syndrome, but it was not statistically significant (1,440.9±168.38 cm/sec vs. 1,395.17±176.232 cm/sec, P=0.312), and in female PWV value was significantly higher in the group with metabolic syndrome than the group without metabolic syndrome (1,630.19±232.608 cm/sec vs. 1,338.25±194.536 cm/sec, P=0.009) (Table was not shown). As the results from the correlation analysis between the variables of metabolic syndrome constituents, both male and female had significant correlation for diastolic BP (r=0.247, P=0.009; r=0.250, P=0.008 [male]), (r=0.693, P<0.001; r=0.569, P< 0.001 [female]), and fasting blood glucose (r=0.201, P=0.035 [male], r=0.454, P=0.004 [female]). The r was higher in female than male, and the significant correlation between TG and PWV in female which was different to male. (r=0.190, P=0.048) (Table was not shown)
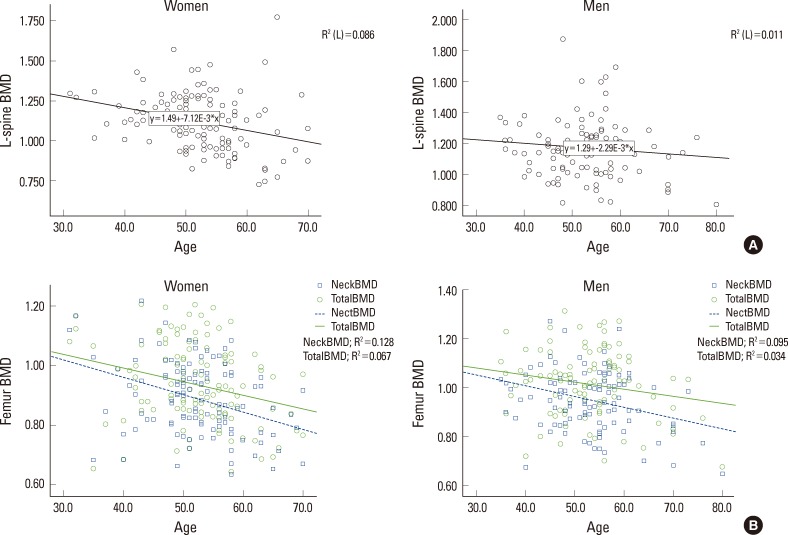
As the results of correlation analysis in female, ba-PWV had a significant inverse correlation in lumbar, coxal articulation neck, and whole coxal articulation. (r=-0.321, P<0.001; r=-0.189, P=0.032; r=-0.177, P=0.046) In male, there was an inverse correlation in lumbar, but it was not statistically significant, (r=-0.154, P=0.107), a nd had a significant reverse correlation in coxal articulation neck, and whole coxal articulation. (r=-0.254, P=0.007; r=-0.202, P=0.034), There was no correlation with PWV in femur trochanter in both male and female. (r=-0.140, P=0.143; r=-0.110, P=0.217) (Table 3). To visualize the correlation between BMD in male and female and ba-PWV, the results were presented as a scatter plot (Fig. 2).

Pearson's correlation coefficients (R) between brachial-ankle pulse wave velocity and clinical parameters in Men and Women

(A) Correlation between lumbar spine bone mineral density (BMD) and pulse wave velocity (PWV) (scatter plot). (B) Correlation between femur BMD and PWV (scatter plot).
In term of age, the most significant proportional relationship was formed with ba-PWV in both male and female. (r=0.46, P<0.001; r=0.525, P<0.001) However, there was no correlation between BMI and PWV in both male and female. (r=-0.116, P=0.226; r=0.061, P=0.497)
4. Analysis of factors that effect on PWV in male and female - results of regression analysis
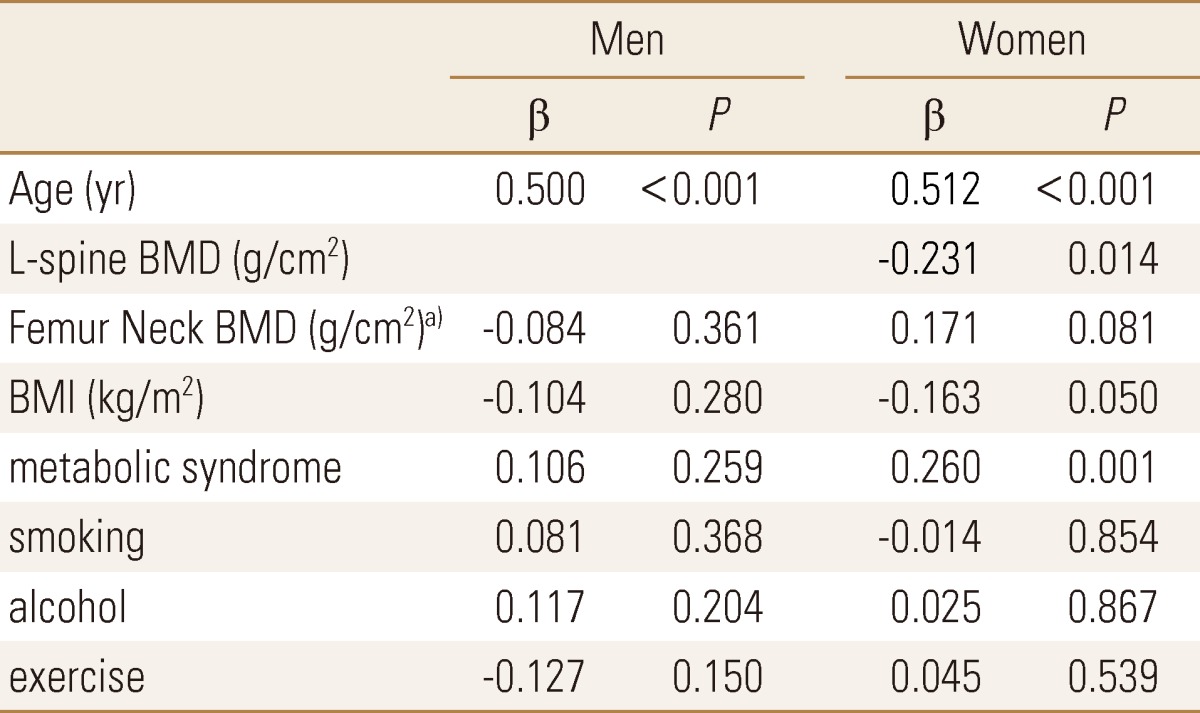
In univariable analysis, the clinically confounding variables without statistical significance such as metabolic syndrome, alcohol intake, smoking, exercise, and BMI were all included as coverable and regression analysis was conducted. The variables which may cause multicollinearity, such as BMD of coxal articulation neck, and whole coxal articulation, only one of the variables were included as coverable for the analysis, and there was no effect on the results. In female there was an independent significant reverse correlation in BMD of lumbar and PWV (r=-0.231, P=0.014) but not in male. There was an independent correlation between age and PWV in both male and female, (P<0.001) and there was an independent correlation between PWV and metabolic syndrome and BMI only in female. (P=0.001, P=0.050) (Table 4).
DISCUSSION
The study was aimed to find out the correlation between BMD and arterial stiffness amongst the healthy male and female who had a health screening, and BMD of lumbar and PWV presented a significantly independent inverse correlation only in female, and in male there was a correlation in BMD of coxal articulation neck, and whole coxal articulation with univariate analysis but there was no independent correlation with multivariate analysis. Age and PWV had the biggest correlation both in male and female. Female had a significantly high PWV with metabolic syndrome, and there was no statistical significance in male but had a same trend to female. The significance of this study is that there was no similar study conducted in a healthy male population and the study included both male and female.
The correlation between BMD and vascular stiffness has not been clearly established in epidemiology and clinical studies, and there are a few cross-sectional studies in Japan which investigated the correlation.
The pathophysiology for the correlation between BMD and vascular stiffness is also not clear. Age, smoking, hypertension, diabetes, hyperlipidemia, renal failure, physical activity, menopause are the risk factors, and factors like inflammatory factor, oxidative LDL, osteopontin, vitamin D, estrogen are predicted to have an effect on the correlation between BMD and vascular stiffness[19,20,21] and osteoprotegerin has been highlighted as an important factor.[22]
In a Japanese study that investigated the correlation between Osteo-sono assessment Index of the calcareous and ba-PWV, there was a inverse proportional relationship between ba-PWV and Osteo-sono assessment Index of the calcareous independent to the risk factor of arteriosclerosis in both male and female. There was more significant relationship in female than male, and the most significant relationship was presented in menopausal women.[10] In a study that investigated correlation between BMD of lumbar and ba-PWV in menopausal women, there was a correlation between increase in ba-PWV and osteoporosis.[11]
Recently a study conducted on African-American female with obesity showed a significant inverse proportional correlation between AI and BMD of lumbar (P=0.01) that of similar to this study, and although the values were on the boundary, coxal articulation neck (P=0.05), and whole coxal articulation (P=0.06) also showed inverse proportional correlation.[12]
Frost et al.[23] conducted a study in menopausal women, and there was a significant inverse proportional correlation between coxal articulation BMD and PWV, but there was no significant correlation in lumbar BMD.[24] The results were probably due to osteophyte, osteosclerosis, osteophytosis and vascular calcification.
This study was conducted in 52 years old male and female subjects who had health screening. In female, spongy bone reduction starts to progress after menopause, and the distribution of spongy bone differs in lumbar and coxal articular areas, hence BMD reduction starts in spine and after 70 years old age, not only spongy bone reduction starts but also the reduction of cortical bone begins and leads to the BMD reduction of coxal articulate.
In many studies with male subjects the lumbar BMD was maintained in 50's-70's and coxal articulate decreased with age and osteoporosis started after 70 years old. On the other hand, in female the reduction of lumbar BMD was observed after 50 years old.[25,26] In this study, only in female had lumbar BMD proportionally increased with age (r=-0.293, P=0.001), and in male there was no proportional relationship between age and lumbar BMD (r=-0.107, P=0.263), and the similar trend was observed from the results of BMD results scatter plot analysis in terms of age.
It is probably due to minor loss of spongy bone due to male hormone, and the characteristics of degenerative arthritis such as osteophyte, osteosclerosis, and osteophytosis. Degenerative arthritis and vascular calcification occur mainly in elderly population, and more common in 60's than 50's. Therefore, mean age of 52 years old with osteopenia patients were mainly included in this study, and there was a weak correlation between PWV and femour BMD both in male and female, but the correlation between lumbar BMD and PWV in female was significant. In this study degenerative arthritis and vascular calcification were occurred in older population and this result was differing from other studies which had low correlation with lumbar BMD and higher correlation with femour BMD. Despite male had higher prevalence of metabolic syndrome, in male PWV did not significantly increase in the group with metabolic syndrome whereas in female PWV tended to increase with metabolic syndrome.
These results were similar to the results of a study conducted in China, that the correlation between metabolic syndrome and ba-PWV were differ in terms of age and gender, and in female metabolic syndrome and it's factors (excl. HDL) had more significant correlation with ba-PWV when those were compared to male (P<0.001) Especially amongst the factors of metabolic syndrome, the correlation between ba-PWV and central obesity and TG were not observed in male, which was opposite in female.[27] In this study, the correlation between PWV and metabolic syndrome factors such as BP, fasting blood glucose were stronger in female than male, and the relationship with TG was additionally observed only in female, hence the correlation between metabolic syndrome and PWV were perhaps observed. Also in female we could not find the correlation between PWV and BMI from the results of simple correlation analysis, but when we included BMI that is known to have correlation with BMD as coverable in multiple regression analysis, there was a significant correlation between ba-PWV and BMI that was independent to metabolic syndrome and BMD. (P=0.050) From a recent study conducted on 228 identical twins and 150 non-identical twins, although BMU had weaker correlation than waist circumference (P=0.009), but showed a significant correlation with arota-PWV (P=0.047),[28] which had a similar result to this study.
In this study the number of subject with metabolic syndrome was very small that of 9 in female and 18 in male, and there is a limitation for the interpretation of the results as metabolic syndrome was classified with BMI instead of waist circumference. However PWV measures arterial stiffness and it reflects arteriosclerosis, which increased due to diabetes and hyperlipidemia, and metabolic syndrome as well would have a correlation as shown in the previous study. However, there are ba-PWV studies lack in healthy adults rather than hypertension, diabetes, and hyperlipidemia, and further studies are warranted as BP could be the confounding factor, and for a firm results for the correlation with metabolic syndrome which insulin resistance and BMI are considered to be important factors.
As we get old arterial stiffness progresses, and increase in systolic BP stands out due to the progress. The proportional correlation between age and arterial stiffness is consistence to the proportional correlation between age and ba-PWV.
This study had a few limitations. First it was a cross-sectional review study with health screening chart of subject who chose to undergo the screening at a tertiary hospital. The causal relationship could not be identified as it was a cross-sectional study, and the collection of data were lacking on smoking, alcohol, exercise characteristics, and data were collected from the consultation with the doctor which could be different to the real-life data. Also secondary osteoporosis due to hypogonadism or history of steroids intake were excluded at the consultation, hence errors could have been made.
Secondly, in this study there was no classification between menopausal women and pre-menopausal women. Estrogen starts to deplete after menopause, and osteoporosis and arteriosclerosis start to progress. The reduction of estrogen is an important factor for the prevalence of arteriosclerosis and osteoporosis both in male and female. This study was a review study with medical charts, there was a lack of data on menopausal status hence the differentiation could not be made.
Also, osteoporosis occurs due to calcium and vitamin D depletion, and there are studies published that calcium and vitamin D are related to arterial stiffness,[29] but in this study we did not take calcium and vitamin D into account.
In conclusion, in female BMD of lumbar and PWV had a significantly independent correlation when age, metabolic syndrome, BMI, smoking, alcohol, exercise were adjusted (r=-0.229, P=0.015), but in male the correlation between BMD and PWV could not be found. However, the limitations like small subject number, and uncontrolled variables such as menopausal status should be supplemented which warrants a number of large prospective studies on the difference between male and female that are well designed for the correlation between BMD and arterial stiffness.


