


INTRODUCTION
Osteoporosis is characterized by low bone mass with consequent increases in bone fragility and susceptibility to fractures and has become a serious public health concern.[1] An osteoporosis prevalence of 36.4% has been reported in Korean adults [2] and older, and postmenopausal women are particularly affected by the disease.[1,2] The Korean National Health and Nutrition Examination Survey (KNHANES) showed that the prevalence of osteoporosis was four times higher in women than men and it was noticeably increased in postmenopausal women aged over 50 years.[2]
Adequate nutrition, especially sufficient calcium and vitamin D intake, play a major role in the prevention and treatment of osteoporosis.[3-5] However, the calcium intakes of Korean women were only 55.2% of the dietary reference intakes for Koreans (KDRI).[6] Vitamin D is an essential nutrient for bone health in terms of optimal calcium absorption, but studies on the average intake of vitamin D among Korean are limited.[7] Identifying suitable methods to assess calcium and vitamin D intake has been highlighted. Dietary records, 24-hour recall, and food frequency questionnaires (FFQ) are used for the assessment of all nutrient intakes and take a long time to finish, but there is no tool for only the calcium intake in Korea. Of the methods that can be used for dietary assessment, FFQ appears to be simple, reliable, and quite convenient. The validated simple FFQ called the Calcium Calculator™[8] and an online version[9] are available to assess the calcium intake of western populations, whose major source of calcium is dairy products. However, we previously showed that Korean women consumed only 1/3 of their calcium intake from dairy products, and that vegetables were a very important source of calcium.[10] Dark green vegetables have been shown to be a viable source of dietary calcium,[11,12] although the calcium they contain has low bioavailability compared to the calcium in dairy sources. Nonetheless, large servings of vegetables might allow a total intake of calcium that is equivalent to that which can be achieved by eating dairy products. Thus, the Korean version of the Calcium CalculatorTM needs to be developed and must include a variety of vegetables.
The purpose of the present study was to develop the Korean Calcium Assessment Tool (KCAT), a modified version of the Calcium Calculator™, and then validate the KCAT by comparing it with the FFQ used in KNHANES. The FFQ used in KNHANES has been developed and validated for KNHANES by the Ministry of Health and Welfare.
METHODS
1. Subjects
This study was conducted according to the guidelines laid out in the Declaration of Helsinki, and all procedures involving human subjects were approved by the institutional review board (IRB) of Chung-Ang University. Written informed consent was obtained from all subjects.
During the summer and fall of 2012, the same numbers of Korean women aged <50 years and ≥50 years were recruited from the outpatient departments and staff members of 6 medical centers: Asan Medical Center, Chung-Ang University Hospital, Hanyang University Hospital Seoul, Kyunghee University at Gangdong, Samsung Medical Center, Catholic University, and Yeouido ST. Mary's Hospital. Women were excluded if they had changed their dietary patterns over the past year or had mental problem, or were pregnant or breast-feeding.
2. Assessment of dietary calcium and vitamin D intake
Information on age, height, weight, and use of calcium supplements were obtained through interviews. Subjects were asked to complete two questionnaires, the FFQ used by the KNHANES (2008) and the newly developed questionnaire for calcium intake called KCAT. The dietary intake for the last 12 months was assessed, and full-scale photographs were used to assist in estimating portion sizes such as tablespoons, cups, slices, units, bowls, plates and cans. Nutritional intake was analyzed using CAN-Pro 4.0 (Korean Nutrition Society, Seoul, Korea).
The FFQ used by the KNHANES included 11 food groups consisting of 63 food items, and the frequency of servings was classified into nine categories: never or seldom, once a month, 2-3 times a month, one to two times a week, three to four times a week, five to six times a week, once a day, twice a day, and three or more times a day.[2] The portion size of the food items was classified as follows: small, medium, or large. On the other hand, KCAT was developed based on the Calcium Calculator™ created by registered dietitians working for the BC Dairy Foundation in the 1980s.[8,9] The KCAT included 7 food groups consisting of 24 categories with 45 food items containing calcium and vitamin D, which were consumed frequently by Koreans (Table 1). Foods with similar calcium content were put into one category and the average calcium content was used. Frequency of servings was recorded as the number of servings per day, week, or month.
3. Statistical analysis
The differences in the intake of calcium and vitamin D between the two questionnaires were analyzed by t tests. Pearson's correlation coefficients were obtained from both questionnaires to compare calcium and vitamin D intakes. The Bland-Altman plot was used to compare the two questionnaires for quantifying the calcium and vitamin D intakes, and Cohen's Kappa Coefficient was evaluated to verify the agreement between the two questionnaires.[13] Statistical analysis was performed using Med Calc Software (MedCalc version 12.4, Ostend, Belgium) and SPSS version 18.0 for windows (SPSS Inc., Chicago, IL, USA). A P value <0.05 was considered statistically significant.
RESULTS
Two hundred and fifty-six women completed both the FFQ used by the KNHANES and the KCAT, and 128 women were <50 years old (Table 2). Women who were aged ≥50 years were significantly heavier and shorter than women who were aged <50 years, but there was no significant difference in the consumption of calcium supplements between the women who were aged <50 years and those who were aged ≥50 years.
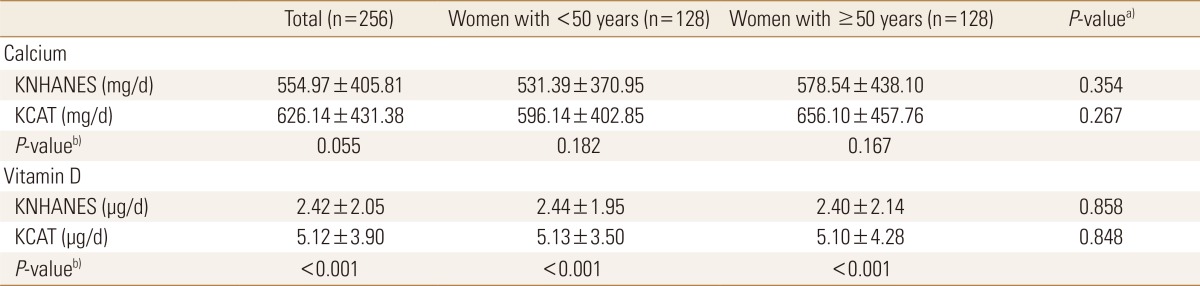
Calcium intakes as assessed by the FFQ used in KNHANES and by the KCAT were not significantly different, but vitamin D intake as assessed by the KCAT was significantly greater than that assessed by the FFQ used in the KNHANES (Table 3). There were no significant differences in calcium and vitamin D intakes between the women who were aged <50 years and ≥50 years.
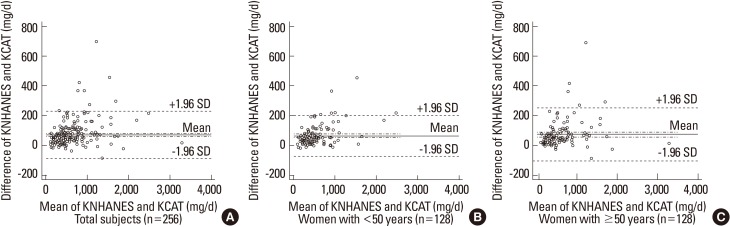
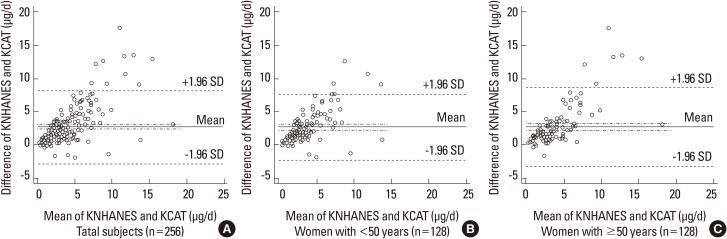
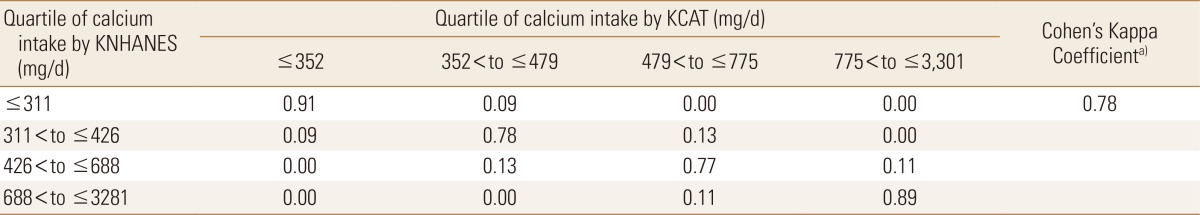
Cohen's kappa coefficient of 0.78 indicated that calcium intakes as assessed by the FFQ used in the KNHANES and the KCAT were in substantial agreement (Table 4), and no subjects were misclassified. On the other hand, Cohen's kappa coefficient of 0.42 indicated that the vitamin D intakes as assessed by the FFQ used in the KNHANES and the KCAT were in moderate agreement, and that 2 subjects were misclassified (Table 5). Pearson's correlation coefficients also showed that there was a significant positive correlation between the intakes of calcium and vitamin D as assessed by the FFQ used in the KNHANES and the KCAT in all subjects, and in women who were aged <50 years and ≥50 years (Fig. 1, 2). In addition, the Bland-Altman plot demonstrated that there were no significant mean differences of the calcium and vitamin D intakes as assessed by the FFQ used in the KNHANES and the KCAT, with 95% limits of agreement (Fig. 3, 4).
DISCUSSION
In the study, calcium intakes as assessed by both the FFQ used by the KNHANES and the KCAT were not significantly different but were significantly and positively correlated, suggesting that the KCAT is a valid tool to assess the calcium intake in Korean women. In the validation study, there was no significant difference in the average calcium intake derived from our new FFQ (KCAT) and the reference method (FFQ used in KNHANES). The Pearson correlation coefficient of 0.98 obtained between the two methods was higher than the range reported in previous studies.[14-21] The FFQ assessing dietary calcium intake in Asian populations showed lower correlation coefficients: 0.51 in Malaysians,[14] ~0.60 in the Japanese,[15,16] and 0.84 in the Vietnamese.[17] On the other hand, in the FFQ assessment of the calcium intake in the western adult diet, a correlation coefficient of 0.64-0.90 between the FFQ and gold standard methods was found.[15,19-21] The values from the FFQ assessment of calcium intake in westerners are higher than those of the calcium FFQ previously developed from Asians. Calcium FFQ for Americans and Europeans generally have good correlation coefficients, probably because the amount of calcium intake is higher on average and the ranges are wider than those for Asians, and also because their sources of calcium are simple, with a large dependence on milk and milk products. The sources of calcium in the Korean diet are more varied than for the Western diet, and they include dark green vegetables, seaweed, beans, and seafood. Calcium in dairy products has high bioavailability and thus shows greater absorption in the intestine than calcium from nondairy products, like dark green vegetables, and soybeans, but large servings of vegetables are important sources of calcium, especially for Koreans who do not often drink milk.[10] Although there were no significant differences in the average calcium intake assessed by the two methods, the calcium intake assessed by KCAT was slightly higher than that assessed by the FFQ used in KNHANES. This difference could be due to calcium fortified milk being included in the KCAT, but not in the other questionnaire.
In addition, the extent of misclassification by the two methods was assessed, and Cohen's Kappa coefficient of 0.78 indicated that the KCAT was able to correctly classify all subjects into the same quartile of calcium intake, with no subject being grossly misclassified. Gross classification according to the quartiles of intake showed reasonable agreement between the two methods. These results are similar to or better than the results of previous studies, where gross misclassification occurred in 0-4%.[15,17] For epidemiologic purposes, the total potential of a questionnaire to categorize subjects by level of nutrient intake is more important than the capacity to measure group means.[22]
Virtually all of the available techniques have been used previously as reference tools against which the various calcium FFQs have been validated, including modified diet history interviews, 4-day weighed or semi-weighed food records, 3-day, 4-day, 7-day, or 14-day estimated food records, as well as 24-h diet recalls and full-length FFQs.[20] Cade et al.[23] suggested that the FFQ could be used in large-scale epidemiological surveys or in clinical settings as a rapid method for ranking the calcium intake, as well as for discriminating between relatively low and probably insufficient (<500 mg/day) calcium intakes from relatively high and probably sufficient (>1,000 mg/day) intakes.
In the present study, we also determined whether the KCAT could be used to assess the vitamin D intake in Korean women. We found that the vitamin D intake as assessed by the KCAT correlated well with that assessed by the FFQ used in the KNHANES, but it was also significantly higher. This may not be surprising since among vitamin D containing foods such as vitamin D fortified milk, different types of mushrooms and fish were not included in the FFQ used in the KNHANES but were added in the KCAT. Therefore, it is possible that the KCAT overestimates the vitamin D intake or the FFQ used in the KNHANES underestimates the vitamin D intake.
In addition, our results showed that Cohen's Kappa coefficient for vitamin D was 0.42 and 2 subjects was misclassified by KCAT, and the correlation coefficient was 0.7. Masson et al.[24] suggested that when using correlation coefficients above 0.5, more than 50% of the subjects are correctly classified and less than 10% of the subjects are grossly misclassified, and a kappa value above 0.4 is desirable in epidemiological studies. Thus, although we were unable to validate it, the KCAT could also be a useful tool to assess the vitamin D intake for Korean women.
This study had a few potential weaknesses. First, using the FFQ used in the KNHANES as a reference tool may not be best for validation purposes since the FFQ depends on long-term memory. However, this method is considered the most suitable to get the population means and distribution for subjects with reasonable accuracy, especially when combined with visual aids for estimating portion sizes. Second, compared to the new FFQ, the KCAT was not validated in all 4 seasons, which may be important to do since seasonal variation may occur in calcium and vitamin D intakes. Third, since participants were recruited from a few communities only, selection bias might have been present.
The KCAT we developed has several strengths. First, the KCAT is simple and convenient. It consists of only 24 questions, and it takes about 10-15 minutes to complete. Thus, the KCAT can be used not only in epidemiologic studies, but also in clinical settings. Second, the dietary calcium intake can be assessed with excellent validity and reproducibility. Third, the intake of vitamin D, which is related to bone health, can be also evaluated. In conclusion, this study suggests that the new FFQ, the KCAT, can be a useful tool to assess calcium and vitamin D intakes in Korean women due to its validity and feasibility.


 PDF Links
 PubReader
 ePub Link
 Full text via DOI
 Full text via PMC
 Download Citation
 Print
Print