


INTRODUCTION
Bone mineral density (BMD) testing is very important for predicting fracture risk and monitoring of osteoporosis treatment response. However, bone turnover markers (BTMs) reflect changes in bone metabolism earlier than BMD.[1,2] BTMs are useful in the monitoring of individual antiresorptive or anabolic therapy,[2,3,4] and early changes in BTMs represent the clinical efficacy of osteoporosis drugs.[4,5] Most postmenopausal women with osteoporosis treated with effective antiresorptive drugs show a reduction in BTMs within a few weeks or months.[1,6] Moreover, BTMs could be used to monitor bone turnover when drug therapy is terminated, and to predict future fracture risk, or to monitor adherence to therapy.[3,4,7,8,9,10,11,12] Bone remodeling rates have been shown to increase dramatically after menopause and are maintained at approximately 3 times the rate seen in premenopausal women.[13] Thus a goal of antiresorptive therapy in postmenopausal women is to reduce bone remodeling rates to those seen prior to menopause.[5] Inadequate suppression of bone turnover has been associated with lack of significant fracture reduction in clinical trial.[14] For use as treatment targets of BTMs in clinical field, we need to have appropriate reference interval (RI) for BTMs derived from healthy premenopausal women with no disease or drugs that may affect bone metabolism. Once an appropriate RIs for BTMs in young premenopausal women has been determined, we can use those for evaluation and management in women with various metabolic bone diseases.
Bone turnover is high until skeletal maturity is reached, usually in the 3rd decade,[15] and some women aged more than 45 years show higher BTMs levels as bone turnover rate is increased in perimenopausal period prior to menopause.[16] Various premenopausal reference age ranges such as 30 to 45 years, 35 to 45 years, and 30 to 39 years and RIs for BTMs based on their data have been published in a number of studies.[5,17,18,19,20,21,22,23,24] It have been proposed in several studies that the target therapeutic goal of antiresorptive therapy is to reduce BTMs to lower half of the normal reference range of the premenopausal women.[2,8,11,25]
In this study, we determined the RI of 2 BTMs, serum C-terminal telopeptides of type I collagen (CTX) and osteocalcin, in Korean healthy women with normal spinal BMD.
METHODS
1. Subjects
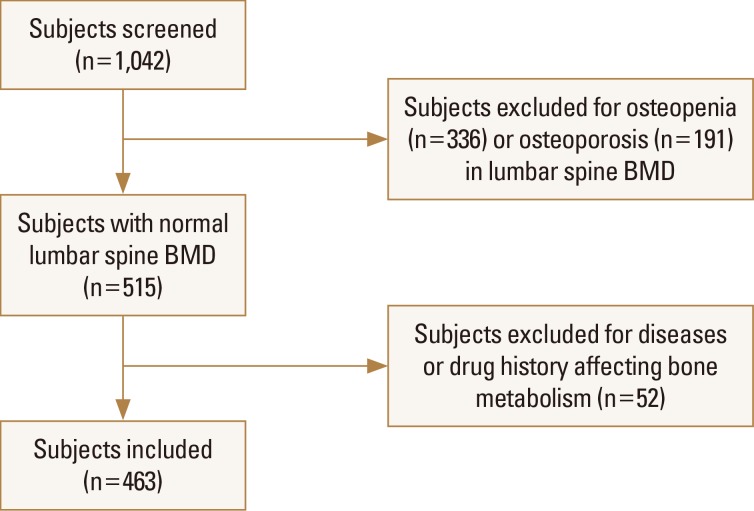
A total of 1,042 women aged 20 to 80 years who visited Chonnam National University Hospital in Gwangju, Korea, from January 2005 to January 2011 for health check were retrospectively reviewed. To determine the RIs for BTMs, we included subjects with normal lumbar spine BMD (T-score ≥−1) according to World Health Organization criteria. The 527 women with low lumbar spine BMD (336 women with osteopenia and 191 women with osteoporosis) were excluded from the study. Of the remaining 515 women, 52 women were excluded based on medical record and abnormal routine laboratory values. We excluded 36 women with following diseases affecting bone metabolism; Graves' disease (n=3), hypothyroidism (n=3), primary hyperparathyroidism (n=1), hypoparathyroidism (n=4), osteomalacia (n=1), Cushing's syndrome due to adrenal adenoma (n=1), Cushing's disease due to pituitary adenoma (n=1), hypopituitarism (n=8), acromegaly (n=1), meningioma (n=1), type 2 diabetes mellitus (n=8), liver cirrhosis (n=1), renal dysfunction (n=1), Crohn's disease (n=1), and breast cancer (n=1). Fifteen women who had received bisphosphonates (n=9), raloxifene (n=1), hormone replacement therapy (n=3), tibolone (n=1), glucocorticoid (n=1) were also excluded. Patients with hypopituitarism mentioned above also had received glucocorticoid and thyroid hormone. One more subject was also excluded due to severe degenerative change of lumbar spine. Altogether, after excluding 579 women, 463 women (287 premenopausal and 176 postmenopausal) were included for the statistical analysis (Fig. 1).
Participants were divided into age group by decade. The body mass index (BMI; in kg/m2) was calculated as the weight (kg) divided by height (m) squared. BMD was measured at the 1st to 4th lumbar vertebra using dual energy X-ray absorptiometry (DXA; GE Lunar, Madison, WI, USA). All blood samples including complete blood count, blood glucose, liver function test, renal function test, total calcium, phosphorus, and BTMs were collected between 08:00 a.m. and 10:00 a.m. after an overnight fast. This study was approved by Institutional Review Board of Chonnam National University Hospital.
2. BTMs
Serum CTX and osteocalcin were measured by Elecsys 2010 using β-CrossLaps/serum kit (Roche Diagnostics, Mannheim, Germany) and N-MID® Osteocalcin kit (Roche Diagnostics), respectively. The monthly based intra- and interassay coefficients of variation (CVs) for both BTMs were maintained below 5%.
3. Statistical analysis
Descriptive statistics were used to summarize both continuous and discrete variables. Data were expressed as means and standard deviation (SD) for continuous variables and as numbers for categorical variables. Far-out values of BTMs in 2 subjects, that are smaller than the lower quartile minus 3 times the interquartile range (IQR), or larger than the upper quartile plus 3 times the IQR, were removed by Tukey method. Finally, serum CTX and osteocalcin levels in 461 subjects were initially explored and assessed for normality by the Shapiro-Wilk or D'Agostino-Pearson test, and found to have distributions that were skewed to the right. Thus Logarithmic transformation was done to normalize the distribution before statistical analyses. Geometric mean was obtained from back transformation from logarithmic transformation. Independent sample t-tests and analysis of variance were used for parametric analyses. For non-parametric analyses, Mann-Whitney U test or Kruskal-Wallis test were used. RIs calculated based on normally distributed transformed data are back transformed to original scale. RIs were determined as the central 95% range between the 2.5th and 97.5th percentiles of serum CTX and osteocalcin concentrations. The 90% confidence intervals (CIs) for the upper and lower bounds of the RI were calculated. The arithmetic mean±SD, geometric mean, median, IQR, and 95% RI were calculated. All statistical analysis was carried out with SPSS version 25 (IBM Corp., Armonk, NY, USA) and MedCalc Version 19.1.3 (MedCalc® Software bvba, Ostend, Belgium). A P-value of less than 0.05 was considered statistically significant.
RESULTS
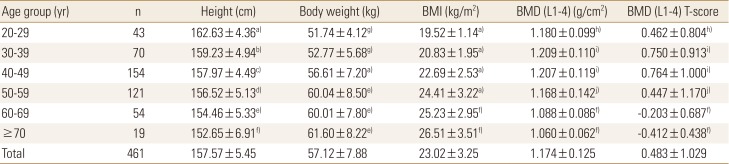
Anthropometric data and BMD are described in Table 1. Height, body weight, BMI, lumbar spine BMD and T-score are described by age group of decade. As we expected, BMD was decreased with increasing age.
The median CTX value (IQR) was 0.322 (0.212-0.461) ng/mL and median osteocalcin value (IQR) was 15.68 (11.38-19.91) ng/mL in all subjects. Those were 0.258 (0.183-0.353) ng/mL and 13.38 (10.65-17.34) ng/mL in premenopausal women, and 0.463 (0.341-0.625) ng/mL and 20.25 (15.1-27.2) ng/mL in postmenopausal women, respectively. BTMs values were significantly higher in postmenopausal women than premenopausal women (P<0.01). RI for serum CTX and osteocalcin in all subjects were 0.115 to 0.861 ng/mL, 6.46 to 36.76 ng/mL, respectively. The RIs were higher in postmenopausal women (CTX, 0.124-1.020 ng/mL; osteocalcin, 5.42-41.57 ng/mL) than in premenopausal women (CTX, 0.101-0.632 ng/mL; osteocalcin, 6.73-24.27 ng/mL) (Table 2).
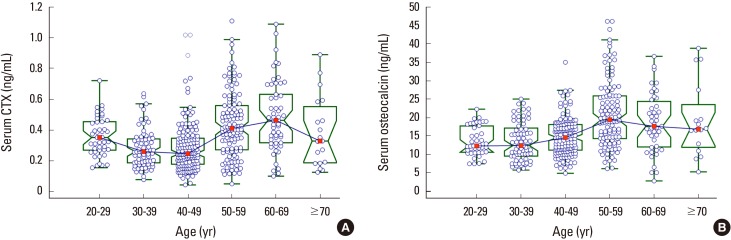
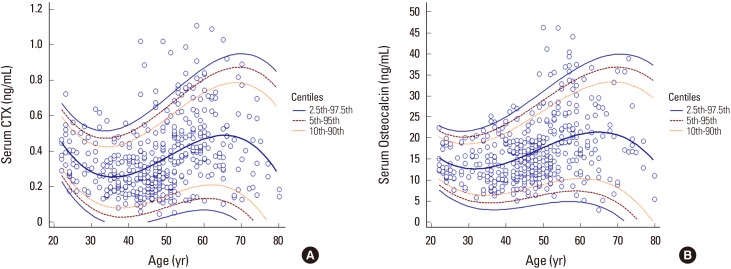
Table 3 shows the age range by decade specific RIs for the BTMs studied and includes the arithmetic means, geometric means, medians, IQR, and 95% RIs. Both BTM values were significantly different among age groups by decade. Serum CTX level was decreased after 20 to 29 years, and maintained in stable concentration to 30 to 49 years, and then abruptly increased in 50 to 59 years, and then decreased with age ≥70 years. Serum osteocalcin level was significantly lower in 20 to 49 years than other age group, and abruptly increased in 50 to 59 years, and then decreased with increasing age (Table 3). Age-related distribution of both BTMs were expressed in Figure 2A, B. Age-related RIs for both BTMs were depicted in Figure 3A, B.
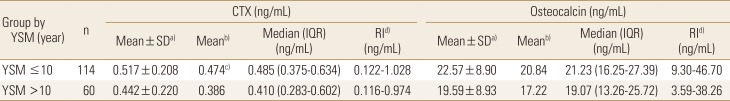
As we expected, postmenopausal women with years since menopause (YSM) ≤10 years shows higher bone turnover rate than those with YSM >10 years (Table 4).
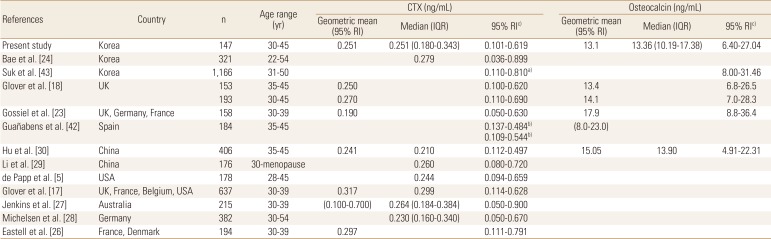
Several studies suggest various age range for premenopausal RI for BTMs. We calculated this RIs from premenopausal women with 30 to 45 years, and they were 0.101 to 0.619 ng/mL for serum CTX and 6.40 to 27.04 ng/mL for osteocalcin (Table 5). When we consider antiresorptive treatment target ranges of lower half of premenopausal RIs in this age group, it might be 0.101 to 0.251 ng/mL for serum CTX and 6.40 to 13.36 ng/mL for serum osteocalcin, respectively.
DISCUSSION
In this study, we established RIs for serum CTX and osteocalcin in healthy Korean women with normal spinal BMD. In general, the RIs for serum CTX and osteocalcin in this study were similar to most of other previous results.[3,5,17,18,26,27,28,29] After stable concentration until 40 to 49 years, both CTX and osteocalcin levels were abruptly increased in 50 to 59 years, and then decreased with increasing age. Women with YSM less than 10 years shows significantly higher BTMs levels than those with YSM greater than 10 years. These changes are due to abrupt increase of bone remodeling after menopause, and similar results are also reported in other studies.[21,23,27,28,29,30,31]
Although the RIs for BTMs in this study were similar to many other previous studies, there are some reports showing ethnic or geographic differences of BTMs. In a study of 637 women from 4 countries (UK, France, Belgium, and USA), serum CTX and N-terminal propeptide of type I collagen were significantly higher in France relative to other countries. However, after adjusting factors such as BMI, smoking habit, exercise, and alcohol consumption, any country differences were attenuated or removed.[17] BTM levels may differ in women of different ethnic origin because many unknown factors may contribute the variability in bone marker levels.[17] There are data showing ethnic groups differ in fragility fracture risk, BMD, and the rate of bone turnover.[32,33,34] Black women have a lower incidence of vertebral and hip fractures than white women. African Americans are reported to have higher plasma parathyroid hormone (PTH) concentrations and a concomitant lower rate of bone turnover compared to white Americans,[33,34,35,36] suggesting that there may be decreased skeletal sensitivity to PTH.[37,38] Therefore, RIs for BTMs need to be established for different geographic area and ethnicities.[3,4,5,17]
An abrupt elevation in the BTMs in association with menopause is widely accepted. Garnero et al. [39] reported 37% and 79% higher levels of osteocalcin and CTX, respectively, in postmenopausal women with YSM <10 years than in premenopausal women. The corresponding differences in the present study were 59% and 93%, respectively, and in the Japanese study,[31] 71% and 138%, respectively. The BTMs levels of postmenopausal women in both present and Japanese studies were higher than those reported for Caucasians by Garnero et al. [39] and Bauer et al. [40]. However, further studies in the different populations are necessary to determine if the racial differences in bone turnover exist.
Bauer et al. [41] proposed RIs for BTMs in older healthy population. They suggested age range of 60 to 75 years to exclude age ≤60 years to avoid the changes of early menopause or menopausal transition and age ≥75 years to exclude very elderly people who commonly have comorbidities that accelerate bone loss. Michelsen et al. [28] reported postmenopausal RI for serum CTX as 0.080 to 0.990 ng/mL in age 60 to 75 years. Gossiel et al. [23] reported RI for serum CTX and osteocalcin in healthy postmenopausal women with age range of 55 to 79 years as geometric mean 95% CI, 0.31 (0.10-1.00) ng/mL and 24.5 (12.7-47.4) ng/mL, respectively. In this study, we also calculated RIs for serum CTX and osteocalcin in age 60 to 75 years: they were 0.110 to 1.040 ng/mL and 3.8 to 38.0 ng/mL, respectively.
Several studies suggest appropriate reference age range for premenopausal RI for BTMs as described in Table 5.[5,17,18,23,24,26,27,28,30,42,43] Most of them suggest these reference age ranges based on their BTMs data that are maintained to stable concentrations. During skeletal growth in young females, bone mass is accrued up until the third decade of life,[44] and bone turnover rate reaches a plateau. Therefore, women under 30 years of age may have elevated bone turnover rate. And there is a possibility of early increase of BTMs due to early menopause or perimenopausal status with age ≥45 years. In one study, they showed there is no significant bone change in 30 to 45 years in women who were calcium balanced and of optimal bone health.[45] However, there is also a suggestion that bone turnover rate might be still higher until 35 years of age due to skeletal immaturity.[18,30] In our study, serum CTX level was somewhat higher in 20 to 29 years than 30 to 49 years. Therefore, we determined premenopausal RIs for BTMs in subjects with 30 to 45 years. Premenopausal serum CTX median level in this study was 0.251 ng/mL, and it is similar to several other previous reported levels such as 0.230 to 0.264 ng/mL.[5,27,28,29] Nearly all of the reported median CTX levels were between 0.2 to 0.3 ng/mL.[5,17,18,26,27,28,29,30] Two other studies with Korean women show more wide RIs for serum CTX.[24,43] One study by Suk et al. [43] showed RI for serum CTX in women with 31 to 50 years without known information of menopausal status, therefore, there is a possibility of including early menopause or perimenopausal women with higher bone turnover rate. In another study by Bae et al. [24], they reported RI for serum CTX in premenopausal women with 22 to 54 years, therefore, there is a possibility of including early adolescent and perimenopausal women with higher bone turnover status. Hu et al. [30] selected reference age range as 35 to 45 years, which were narrower than other studies, and reported lower median level as 0.210 ng/mL. In their report, serum CTX level was still higher in 30 to 34 years, which may suggest that they had not yet reached skeletal maturity.[30] Glover et al. [18] also suggested that BTMs were higher under the age 35, and reported 0.250 ng/mL as geometric mean in 35 to 45 years [18]. We also analyzed serum CTX levels between 30 to 34 years and 35 to 45 years. However, there was no statistical difference between these 2 age groups (data not shown), and geometric mean was similar to our result. Premenopausal serum osteocalcin median level in this study was 13.36 ng/mL, and it is similar to the level reported by Hu et al. [30]. Geometric mean 13.1 ng/mL in our study was similar to 2 other studies as 13.4 and 15.05 ng/mL.[18,30] In one study, serum CTX and osteocalcin levels determined as geometric mean were somewhat different from other studies. However, they acquired non-fasting blood sample for BTMs and used narrower reference age range of 30 to 39 years (Table 5).[23]
In several studies, the lower half of the premenopausal RI (values between the lower limit of the RI and the median) has been proposed as a target for antiresorptive drug treatment.[23,25] From this point of view, when antiresorptive drugs are used, we suggest the treatment target ranges of lower half of premenopausal RIs might be 0.101 to 0.251 ng/mL for serum CTX and 6.40 to 13.36 ng/mL for serum osteocalcin, respectively. When we considering the median levels and 95% RIs for serum CTX and osteocalcin, these treatment target ranges were similar to the results of other studies (Table 5).[5,17,18,23,26,27,28,30,42]
This study have several limitations. First, because the subjects in this study visited for health examination and checked BMD only at the spine. So, there is a possibility that some subjects, especially with aged women, have low bone mass at the femur in spite of normal spine BMD. Second, dietary calcium intake was not analyzed in this study; therefore, we could not identify the effect of calcium intake on bone turnover. Third, vitamin D level was not available. Because vitamin D is important for maintenance of bone mass, we could not examine the effect of vitamin D level for bone turnover rate. Fourth, all medical and drug history was obtained only by medical record. So, there is possible recall bias. However, we selected subjects with normal spinal BMD with T-score more than −1.0; therefore, the effects of these issues might not be great.
In conclusion, we determined RIs for serum CTX and osteocalcin in healthy Korean women with normal spinal BMD. Especially, RIs for 2 BTMs in premenopausal healthy women with 30 to 45 years will contribute to the appropriate assessment and monitoring of bone turnover rate in the evaluation and management of osteoporosis.


 PDF Links
 PubReader
 ePub Link
 Full text via DOI
 Full text via PMC
 Download Citation
 Print
Print