


INTRODUCTION
Osteoporosis is a common yet debilitating disease that can increase the risk of bone fracture and mortality rate and may result in significant epidemiologic and economic burden in South Korea, as the aging population in South Korea is on the rise.[1,2] While vitamin D and calcium were considered to be the main nutrients for prevention of osteoporosis, the role of fiber consumption with respect to bone health has been controversial.[3] Moreover, population-based epidemiological or experimental studies exploring the association between dietary fiber consumption and bone mineral density (BMD), particularly studies using data from human participants, were extremely rare and study results of fiber intake and its clinical impact in bone health are conflicting.[4,5,6,7] Furthermore, no long-term quality observational or experimental trial examining the effect of fiber content in the typical Korean diet on bone mineralization has ever been conducted, nor any causal association between fiber intake and BMD in the South Korean population ever been found thus far. The correlations between the amount of daily fiber intake and BMDs in Korean adult population were investigated in our study.
METHODS
1. Study population
The Korean National Health and Nutrition Examination Survey (KNHANES) is a national nutrition survey performed to evaluate the health and nutritional status of the Korean people since 1998 by Korea Centers for Disease Control & Prevention with the supervision of Ministry of Health and Welfare, South Korea. The participants in KNHANES were selected by using a multi-stage clustered probability design to ensure representation of Korean citizens residing in Korea. In this cross-sectional study, the data from KNHANES conducted in 2011 were used. Each sampling unit (SU), which is geographically defined across the country, consists of 60 households. A total of 192 SU out of approximately 200,000 were randomly selected from the 2011 survey. A face-to-face interview was conducted for the dietary survey using the 24 hr recall method. Because the data for daily dietary intake of nutrients were reported separately from that for BMDs of each participant in the 2011 survey, we manually merged 2 data sheets through matching the participant's identification number reported in KNHANES.
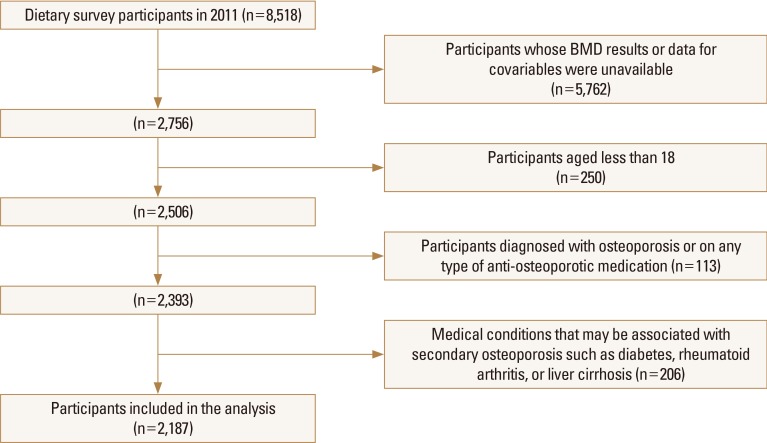
Among 8,518 individuals participating in the dietary survey in 2011, the BMD results and nutritional covariates were available only for 2,756 individuals. We excluded data of participants aged less than 18 years (n=250). Participants diagnosed with osteoporosis or on any type of anti-osteoporotic medication (n=113) were excluded from the study. Individuals who reported that they were diagnosed with medical conditions that may be associated with secondary osteoporosis such as diabetes, rheumatoid arthritis, or liver cirrhosis (n=206) were also excluded from our study. After the exclusion criteria were applied, a total of 2,187 participants were included in the analyses. Figure 1 shows the inclusion and exclusion criteria for participants in this study.
2. Quantification of daily nutritional intake and measurement of BMD
Nutrients that were selected for inclusion in the analysis were dietary fiber, carbohydrate, protein, fat, calcium, phosphorus, iron, thiamine, riboflavin, niacin and vitamin C. The daily amount of each nutrient that participants consumed was calculated using the nutrition facts label on foods provided by Korea Food Research Institute (https://www.kfri.re.kr/?c=6/47/118). Both the survey methodology and quantification of daily nutritional intake reported in greater detail can be found at the following web address: https://knhanes.cdc.go.kr/knhanes/sub04/sub04_02_02.do?classType=4. BMD of lumbar vertebrae 1-4 (L1-4 total), L1, L2, L3, and L4 vertebrae, femur neck, femur total, and trochanter were measured using dual energy X-ray absorptiometry (DISCOVERY-W; Hologic, Bedford, MA, USA).
3. Statistical analyses
Descriptive statistics of survey participants' daily consumption of each nutrition and mineral were performed as follows: Student t-test was utilized for continuous variables and χ2 test were applied for dichotomous variables. One-way analysis of variance test was used to determine statistically significant differences between subgroups. Data are reported as mean±standard deviation unless otherwise indicated in the table legends. Multivariable linear regression was performed to explore the association between fiber consumption and BMD of L1, L2, L3, and L4 vertebrae, L1-4 total, femur neck, femur total, and trochanter. All models were adjusted for age, body mass index (BMI),[8] serum vitamin D level,[9] cigarette smoking (current smoker vs. never smoker or quit smoking more than 1 year),[8] physical activity,[10,11] alcohol use,[12] daily consumption of carbohydrate,[6] protein,[13,14,15,16] fat,[17] calcium,[17,18] phosphate, iron, thiamine, riboflavin, niacin, and vitamin C [17,19] except for contraceptive use (current user vs. never or formerly used), hormonal replacement therapy (current user vs. never or formerly used), which were included solely in the regression model for female. Given that sex hormones may modify the effect of dietary fiber on bone loss, the regression analyses for men and women were conducted separately.[20] As osteoporosis screening starts at the age of 65 and risk assessment for osteoporosis starts at age 45 at the earliest, age-subgroup analyses were conducted within male and female participants as follows: subgroup (1) aged 16 to 45; (2) 46 to 64; and (3) older than 65.[21] All statistical data were analyzed using the IBM SPSS software version 23.0 (IBM Corp., Armonk, NY, USA). The statistical significance was set at 0.05.
RESULTS
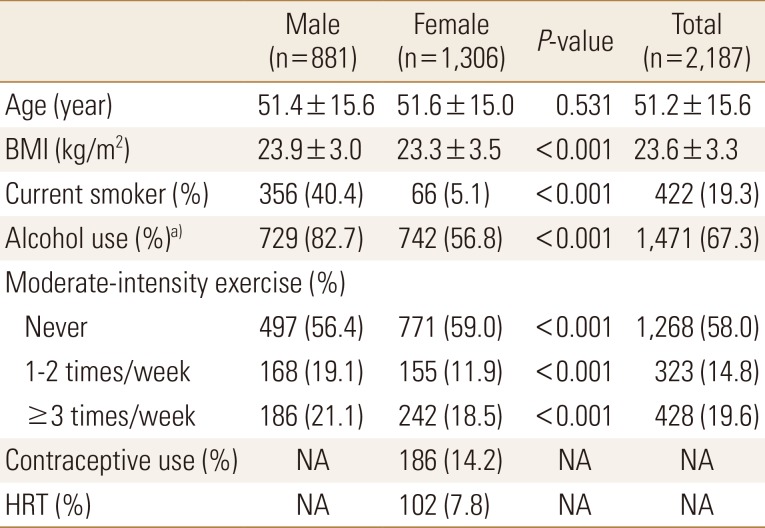
A total of 2,187 participants were included in the analyses. Mean age of participants for male and female were 51.4 and 51.6 years old, respectively. Female participants were 59.7% of 2,187 individuals. Among female participants, 14.2% of them reported that they had a history of contraceptive use while 7.8% of them were on hormone replacement therapy at least in the previous year. Table 1 provides the characteristics of survey participants.
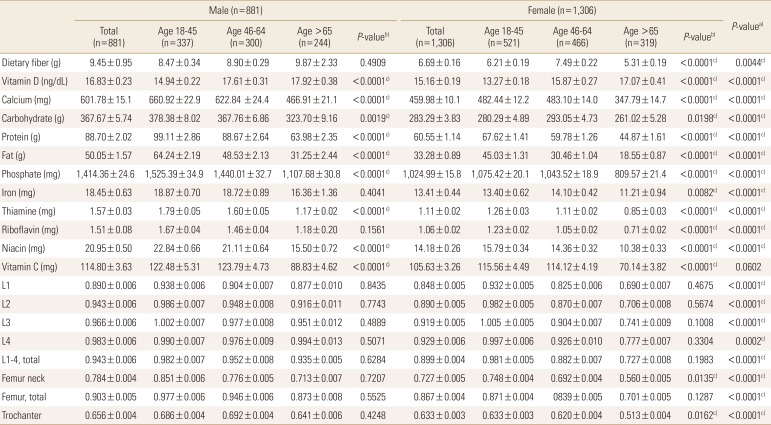
The average amounts of daily fiber intake for men and women were 9.08 g and 6.34 g respectively, which were below the recommended amount of daily consumption. The serum levels of 25-hydroxy-vitamin D (25[OH]D) for men and women were 16.82 ng/mL and 15.40 ng/mL respectively, which were below the lower limit of normal range of 25(OH)D. The mean amount of daily calcium intake for men and women were 583.56 mg and 437.77 mg respectively, which were below the recommended amount of daily consumption.
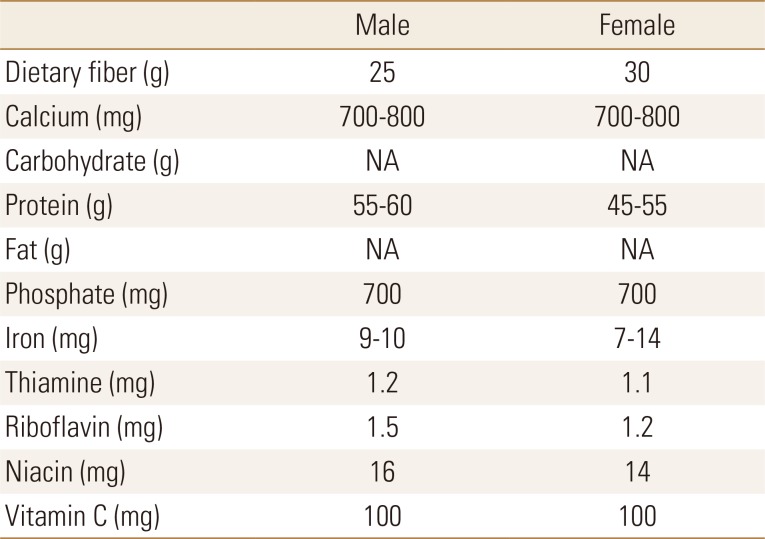
There were significant differences between men and women in the amount of consumption for dietary fiber (P=0.0044), calcium, carbohydrate, protein, fat, iron, thiamine, riboflavin, and niacin (P-value for all except for dietary fiber were P<0.0001). However, the amount of vitamin C intake showed no difference between men and women (P=0.0602). Table 2 provides the average amount of nutritional consumption and BMD of L1-4 total, L1, L2, L3 and L4 vertebrae, femur neck, femur total, and trochanter of the study population by age groups and gender. Table 3 provides the amount of recommended daily consumption of each nutrient and vitamin in South Korea.[22]
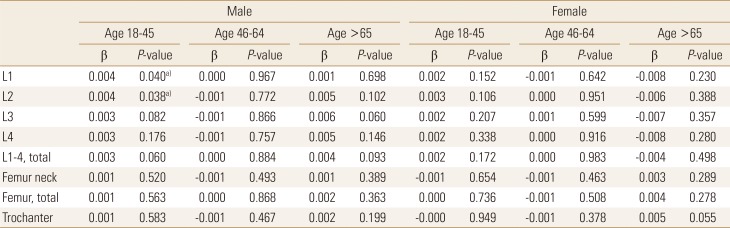
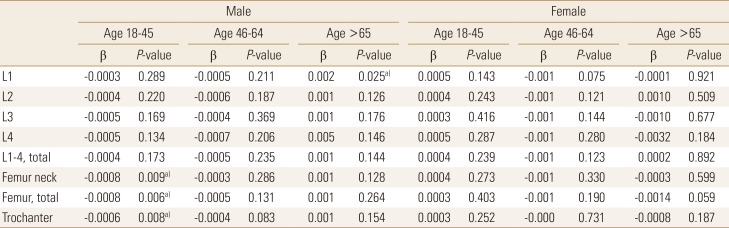
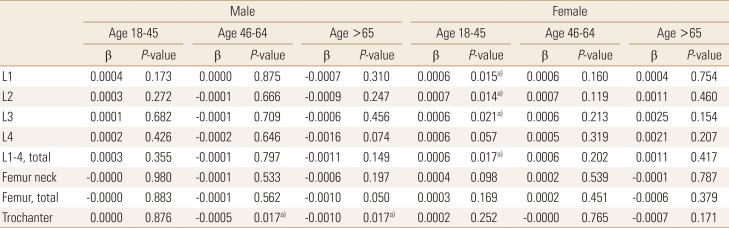
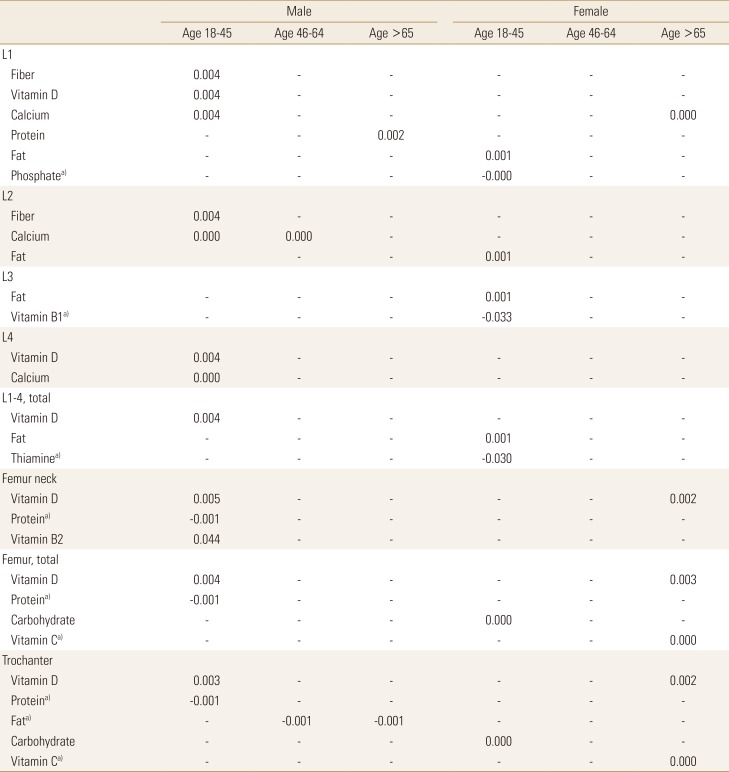
For the male group, there were no significant associations between dietary fiber intake and BMD of each bone area. However, in males aged between 18 and 45, fiber intake significantly increased BMDs of L1 (regression coefficient β=0.004, P=0.040) and L2 (β=0.004, P=0.038); there was a 0.004 g/cm2 increase in BMD of L1 and L2 for additional 1 g of daily fiber intake. However, daily protein consumption significantly lowered BMDs of femur neck (β=−0.001, P=0.009), femur total (β=−0.001, P=0.006), and trochanter (β=−0.001, P=0.008); there was a 0.001 g/cm2 decrease in BMD of femur neck, trochanter and intertrochanter for additional 1 g of daily protein intake. In the same age group, no significant association was identified between dietary fiber intake and L3, L4, L1-4 total, femur neck, femur total, and trochanteric area. In male aged between 46 and 65, fiber intake showed no significant association with any bone area of interest in our study. In males aged 65 and older, nutrient intake did not show any significant correlations with BMDs except fat consumption, which was inversely associated with BMD of trochanter (β=−0.001, P=0.017); there was a 0.001 g/cm2 decrease in BMD of trochanter for additional 1 g of daily fat intake. Table 4, 5, 6 provide the regression coefficient of daily dietary fiber, protein and fat consumption by age groups and gender, respectively. Table 7 provides independent covariates (nutrition and minerals only) that were statistically significant in the regression model.
For the female group, no significant associations were found between dietary fiber intake and BMD of each bone area. In females aged between 18 and 45, fiber intake showed no statistically significant relationship with BMDs of any bone regions of interest, either. However, in the same age group, daily fat consumption significantly increased BMDs of L1 (β=0.001, P=0.028), L2 (β=0.001, P=0.024), and L3 (β=0.001, P=0.033); there was a 0.001 g/cm2 increase in BMD of L1, L2, and L3 for additional 1 g of daily fat intake. Additionally, daily carbohydrate consumption significantly increased BMDs of femur neck (β=0.0001, P=0.044), and trochanter (β=0.0001, P=0.045) in the same age group of female; there was a 0.0001 g/cm2 increase in BMD of femur neck and trochanter for additional 1 g of daily carbohydrate intake. In female aged between 46 and 65, fiber intake showed no significant association with BMD of any bone area of interest. In females aged 65 and more, while fiber was not also significantly associated with BMD of any bone area, the daily consumption of vitamin C showed negative correlations with BMD of femur total (β=−0.0004, P=0.013) and trochanter (β=−0.0004, P=0.003) respectively; there was a 0.0004 g/cm2 decrease in BMD of both femur total and trochanter for additional 1 mg of daily vitamin C intake.
DISCUSSION
The associations between daily fiber consumption and BMD of L1, L2, L3, and L4 vertebrae, L1-4 total, femur neck, femur total, and trochanter were investigated in our study. Daily fiber intake was a protective factor of BMD of L1 and L2 vertebrae particularly in males aged between 18 and 45 but not in females of any age group. However, dietary fiber consumption showed no significant associations with BMD of L1-4 total, nor was it with femur neck, femur total, and trochanter in any age group regardless of sex.
A recently published 8-year of follow-up longitudinal cohort study using the Framingham offspring cohort demonstrated the higher the amount of daily dietary fiber the male participants consumed, the less bone loss of femur neck they experienced.[23] The positive relationship between fiber intake and bone health in younger male group in our cross-sectional study was in line with the study outcome of the Framingham offspring cohort study; higher fiber intake increased BMD of femur neck only in males. Notably, sex difference in the association of dietary fiber and BMD was evident in both studies regardless of types of dietary fiber that study participants consumed; most of the study participants in the Framingham offspring cohort study were Caucasians whose sources of fiber may be different than those of most Koreans.[23]
The positive impact of dietary fiber consumption may be explained by the production of short-chain fatty acid (SCFA) during the fermentation of fiber in the intestine; the SCFA may facilitate the absorption of calcium.[24] Considering that fiber can increase the intestinal lumen resulting in a larger surface of calcium absorption, fiber consumption can even enhance the effect of SCFA on calcium absorption.[25] However, it is unclear where the difference in the age-group specific positive impact of fiber consumption on BMD comes from. Considering the relatively small sample size in our study, the association between fiber consumption and bone health may be better characterized as age difference in a study with more extensive sample size in the future.
Plausible mechanism behind the sex difference in terms of associations between fiber consumption and BMD also remains unclear. In order to adjust for the hormonal impact on bone mineralization, the regression analyses for men and women were conducted separately. Also, in an effort to elucidate where the sex difference comes from, we included the use of contraceptives and hormone replacement therapy in the regression model for women since exogenous sex hormone uses may influence the degree of BMDs in female groups. Even in the pre- and post-menopausal subgroup analyses, fiber consumption did not show any significant association with BMDs of any bone areas. The sex difference in the associations between fiber and bone health may be explained by the sex differentials in overall gut microbiome composition and its role of SCFA in bone mineralization.[20,26]
Due to lack of scientific evidence concerning either beneficial or harmful effects of fiber consumption, upper or lower limit that indicates required amount of average fiber intake per day has not been reported in Korea. Instead, based on median value of average amount of fiber consumption reported in KNHANES, the Korean Nutrition Society estimated sufficient rather than necessary amount of daily fiber intake in Dietary Reference Intake for Korean 2015 (KDRI 2015).[22] The KDRI 2015 suggested that the sufficient amount of daily fiber intake for Korean adults is 25 g/day for men and 20 g/day for women regardless of age.[22] However, in our study, average amounts of daily fiber intake for men and women were 9.08 g and 6.34 g respectively, which were far below the recommended daily intake in Korea. The most recent practice guideline for osteoporosis published by the Korean Society of Bone Metabolism in 2018 reported that fiber consumption may hinder calcium absorption and specified that they do not recommend patients with osteoporosis to consume dietary fiber, leaning in the negative impact of fiber consumption on bone health.[27] However, the evidence to support their recommendations on fiber consumption was not clearly indicated in the guideline. Further, Gordon et al.[28] pointed out in their review literature that even 50 g total dietary fiber per day are not expected to cause any negative impact on mineral bioavailability. Given the complexity of research hypothesizing possible relationships between fiber and its clinical implication due to potential interactions between foods and nutrition, population specific epidemiologic study may be an alternative methodology to provide more solid evidence in clinical practice. Extensive population-based epidemiologic study for the Korean population may be warranted to revise current recommendation on fiber consumption for prevention and management of osteoporosis.
As proven previously in other studies, protein consumption showed its negative impact on BMD of femur neck, femur total, and trochanter in our study as well.[13,14,15,16] In a study conducted by Lim et al.[29], authors pointed out that the daily consumption of protein was increased particularly in college students in Korea. It is quite concerning given that the excessive protein intake may have negative impact on bone health particularly in younger adults in Korea.
Unlike previously published epidemiologic studies that showed the positive effect of vitamin C on bone health, consumption of vitamin C significantly lowered BMD of femur total and trochanter in female older than 65 in our study.[19] Currently, the critical role of vitamin C in bone mineralization can be explained by the effect of vitamin C on collagen maturation.[30] New epigenetic studies are in progress in order to identify the potential causal association between consumption of vitamin C and bone mineralization at the molecular level.[31] Such studies may lessen the potential bias and limitations that epidemiologic population studies possess and provide better explanations for the contradictory results with respect to the impact of vitamin C on bone health in population-based studies.
In our study, daily fat consumption significantly increased BMD of L1-4 total, L1, L2, and L3 in younger females aged between 18 and 45 while it decreased BMD of trochanter in middle-aged men older than 46. The positive impact of fat consumption on bone health in the younger age group (female aged 18-45) may be explained by the essential role of high-fat diet in achieving peak bone mass during growth at a younger age.[32] On the other hand, fat consumption and its negative impact on bone health in the older age group (male aged 46 and older) may be associated with deteriorating changes in bone microstructure that high fat intake can bring about; as bone strength reduces, high-fat diet can alter the bone marrow environment and create inflammatory environment, which eventually cause detrimental effect on bone microstructure.[33] Regarding the role of sex difference in the relationship between fat consumption and BMD, however, further research is warranted to elucidate the pathophysiologic mechanism behind.
Even though KNHANES entails comprehensive and large-scale information of foods and nutritional patterns in South Korea, the study outcomes should be interpreted cautiously because the outcomes may be confounded by the potential recall bias that comes from the fact that the survey was based on the participants' ability to recall all food items consumed for the last 24 hr. Also, there is the possibility of bias arising from lack of representativeness in our study since we included survey participants who had documented record of BMDs of bone areas of interest. Due to the limited number of patients included in our study, the data we selected from the KNHANES may not represent entirely the accumulative nutritional status or daily dietary patterns of the South Korean population. Larger sample sizes may address these limitations of our study. However, our study is, to our knowledge, a novel population-based research that aimed at ascertaining potential association between daily consumption of dietary fiber and bone health, particularly using Korean food items. Our study may lead to further experimental study to verify the positive associations between fiber consumption and bone mineralization.
 PDF Links
 PubReader
 ePub Link
 Full text via DOI
 Full text via PMC
 Download Citation
 Print
Print