Is Sarcopenia a Potential Risk Factor for Distal Radius Fracture? Analysis Using Propensity Score Matching
Article information
Abstract
Background
Cases of low-energy-induced distal radius fracture (DRF) are increasing. Sarcopenia is considered to be an independent risk factor for fragility fractures. We compared body appendicular lean muscle mass (ALM) and bone mineral density (BMD) in patients with DRF and a comparable control population. This study aimed to investigate the correlation between skeletal muscle mass and DRF.
Methods
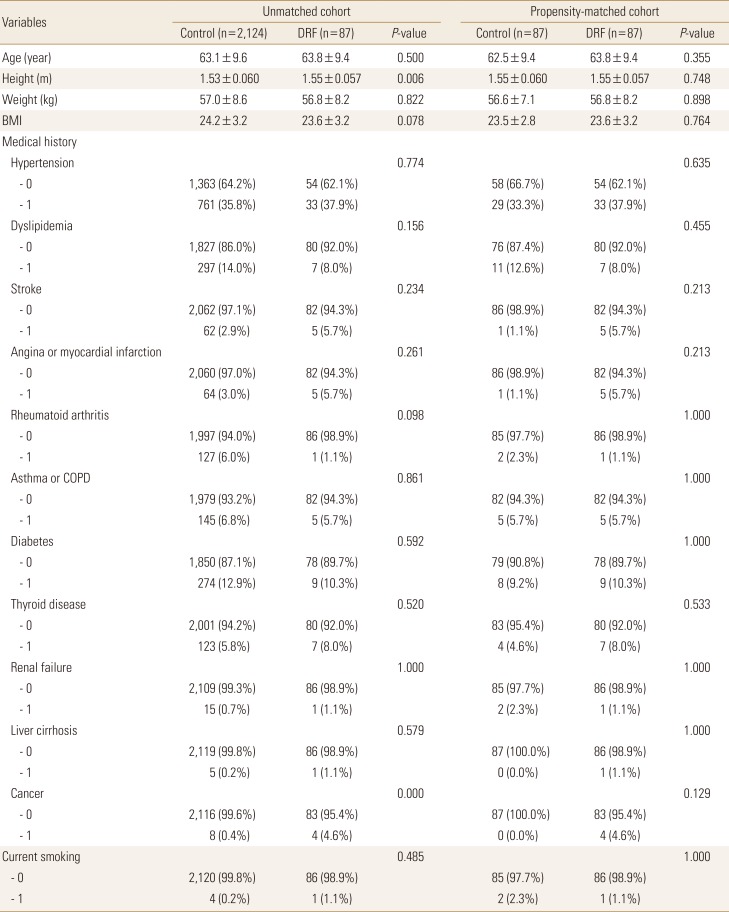
We performed a retrospective review of patients diagnosed with fragility DRF. The DRF group included 87 patients treated at our institute. The control group comprised data for 87 individuals in the general population from among 2,124 selected using nearest-neighbor propensity scoring, based on age, weight, height, and body mass index. All medical conditions and past history were also compared between the two groups.
Results
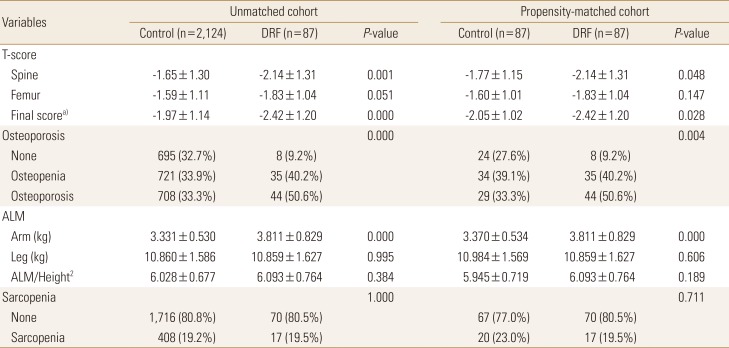
The relative overall ALM, combining arm and leg lean body mass divided by height squared, was not significantly different (DRF group, 6.093 kg/m2; controls, 5.945 kg/m2). T-score, a parameter of BMD, was significantly different between groups (DRF, −2.42; controls, −2.05). The proportion of patients with osteoporosis was significantly different (DRF, 44 [50.6%] vs. control, 29 [33.3%], respectively).
Conclusions
Patients with DRF did not have significantly lower average lean body mass. BMD was significantly lower in patients with DRF than in controls.
INTRODUCTION
Distal radius fracture (DRF) accounts for approximately 16% of all fractures treated by orthopedic surgeons.[1] The occurrence of DRF peaks in two age groups: 1) a young, predominantly male population with high-energy; and 2) an elderly, predominantly female population.[2] These two different peak distributions represent distinctive injuries in terms of mechanism of injury, predominate age, amount of energy associated with the fracture, and fracture characteristics. As the life span of the general population increases, the incidence of DRFs in the second group of older, female patients is increasing. Risk factors for DRF in elderly patients have been studied. Osteoporosis is a recognized leading cause of fractures; female sex, ethnicity, heredity, previous fracture history, and early menopause have also been found to be risk factors for this injury.[134]
Sarcopenia, the degenerative decrease of skeletal muscle mass (0.5%–1% loss per year after the age of 50) has been investigated as a new risk factor for fracture.[5678] Regardless of bone density, sarcopenia appears to be an independent risk factor for fragility fractures leading to a condition known as sarco-osteoporosis.[7] With respect to DRF, Roh et al.[6] reported a higher prevalence of sarcopenia in patients with DRF compared to age- and sex-matched controls.
Dual energy X-ray absorptiometry (DXA) has been employed as a measurement tool for bone mineral density (BMD) in the diagnosis of osteoporosis. This useful tool is currently expanding from solely evaluating bone density to measuring other components of the musculoskeletal system, by separating body mass into bone mineral, fat, and lean body mass (fat-free soft tissue).[910] In particular, DXA is useful for detecting appendicular muscle (arm and leg) mass surrounding well-recognized bone. Therefore, researchers employed the appendicular lean mass (ALM), the sum of the lean soft tissue masses of the arms and legs, as a sarcopenia measurement tool.[10] Furthermore, as an index of relative muscle mass, ALM divided by the height squared (ALM/ht2) was proposed.
Using DXA measurements, we evaluated body appendicular muscle mass of the upper and lower extremity and BMD between patients with DRF at a single institute and compared them to a control population acquired from the Korea Centers for Disease Control and Prevention (KCDC).[11]
Authors predicted patients of DRF presented lower muscle mass as well as bone density compared with matched normal population. And this study aimed to investigate the correlation between appendicular muscle mass and DRF.
METHODS
We carried out a retrospective review of patients diagnosed with fragility DRFs under the official approval of the Institutional Review Board (CHAMC 2017-11-003). Between January 2015 and December 2017, we identified 131 patients who underwent ALM and BMD assessment under informed consent with consecutive method. The DRFs were properly treated with conservative or operative management based on current treatment principles. To isolate the role of sarcopenia in DRF, we carried out a study targeting fragile fracture.[12] Inclusion criteria were: female sex, age over 50-years, and fracture from low-energy trauma including a fall from a standing height or low height of less than 1 m.[13] Medical conditions affecting sarcopenia were questioned including hypertension, dyslipidemia, stroke, angina or even myocardial infarction, rheumatoid arthritis, asthma or chronic obstructive pulmonary disease, diabetes, thyroid disease, renal failure, hepatic failure, cancer diagnosis, and current smoking condition.[141516]
BMD was measured at both the lumbar spine and one proximal femoral area (Lunar Prodigy Advance; GE Lunar, Madison, WI, USA) and osteoporosis was diagnosed based on a T-score less than 2.5 standard deviation (SD) below the mean, according to World Health Organization criteria.[17] ALM was measured for the upper and lower extremity separately. The ALM was divided by the height squared (ALM/ht2) as relative value for comparison. Instead European cuff off value of 2 standard deviations from the mean, with different values for men (<7.26 kg/m2) and women (<5.45 kg/m2), adjusted criteria considering Asian low muscle volume were employed to diagnose sarcopenia (male <7.00 kg/m2; female <5.40 kg/m2).[1819] Patients with incomplete or absent assessments (i.e., femoral BMD measurement in a patient with a history of bilateral total hip replacement) were excluded. Finally, a total of 87 patients were selected for the DRF group.
For the control group, we utilized general population data from the Korea National Health and Nutrition Examination Surveys (KNHANES) for 2008 to 2011.[11] During this period, KNHANES, led by the KCDC, measured ALM and BMD under their own IRB approval, and some of the data has been released for medical research. ALM and BMD measurements were based on DXA (QDR 4500A; Hologic Inc., Bedford, MA, USA). With the data from this study, we have access to information on the enrolled population including age, sex, height, weight, medical history, past history of any fracture, ALM, and BMD. Between 2008 and 2011, we identified data of 21,303. Individuals with any fracture history, male gender, and age less than 50-years-old were then excluded. Patients of insufficient information were excluded finally. Overall 2,243 individuals were identified before propensity score matching with the DRF group (Fig. 1).
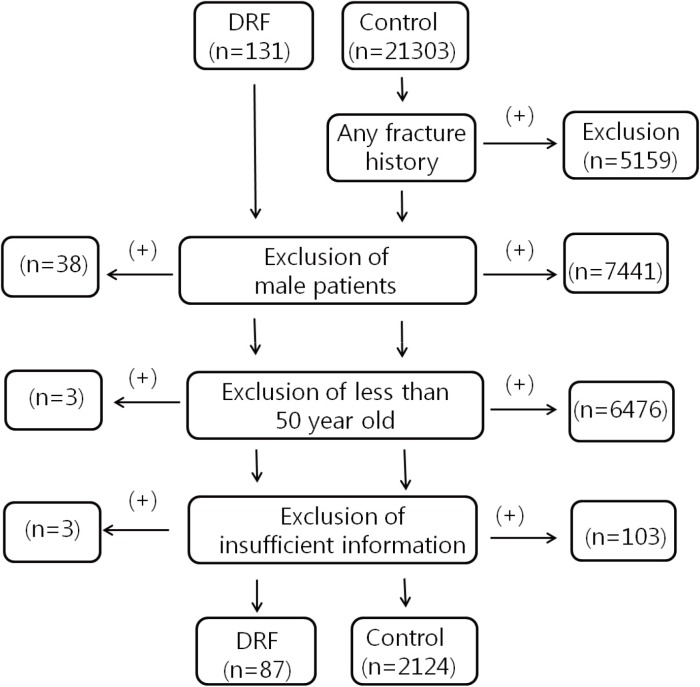
Flow sheet of patient selection process for the distal radius fracture (DRF) and control groups.
A nearest-neighbor propensity score matching was employed to create a comparable control group. The matching variables of age, weight, height, and body mass index (BMI) were inserted for a propensity score matching algorithm between the two groups; we obtained the same number of individuals for the DRF and control group groups (Fig. 2). Overall, 87 patients with DRF and 87 controls were enrolled before statistical comparison. First we compared demographic factors between patient and control group in unmatched comparison as well as matched comparison (Table 1). Based on the Asian sarcopenia guideline and diagnosis of osteoporosis criteria, determined from lowest T-score, the proportion of patients with sarcopenia and osteoporosis were evaluated.
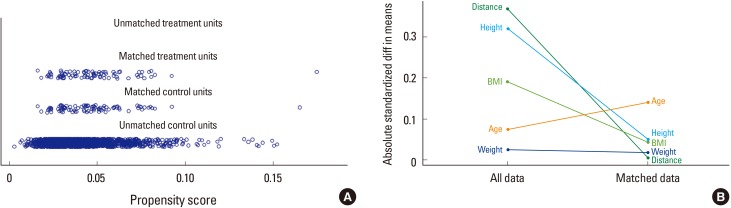
Statistics of nearest neighbor propensity score matching, age, height, weight, and body mass index (BMI). (A) Distribution of propensity scores. (B) Change of absolute standardized differences.
Descriptive statistics by ‘group’
1. Statistical analysis
Propensity score matching was used to select the control group. The Pearson χ2 test or Fisher's exact test for categorical variables and the Student t-test for continuous variables were used for comparison between groups. Before the Student t-test was performed, the normality test (Shapiro-Wilk test) was applied to continuous variables. A P-value less than 0.05 was considered statistically significant. The statistical evaluation was conducted using software R (version 3.1.0; The R Foundation for Statistical Computing, Vienna, Austria).
RESULTS
Table 2 present our study outcome, unmatched and matched comparison of ALM and BMD.
Comparison of bone mineral density and body composite
1. Matched comparison: BMD
DRF presented lower BMD compared with control groups indicating similar outcome prior to propensity score matching. Mean L-spine T-score of DRF was −2.14 compared with control of −1.77 (P=0.048). Femoral T-score of DRF also presented lower score through statistical insignificance (DRF, −1.83; control, −1.60; P=0.147). In final T-score comparison, DRF present lower score compared with control group (DRF, −2.42; control, −2.05; P=0.028) (Fig. 3). The proportion of patients with osteoporosis was different between the DRF and control groups with statistical significance (DRF, 44 [50.6%] vs. control, 29 [33.3%], respectively).

Comparison of bone mineral density (BMD), with significant difference (P=0.028). DRF, distal radius fracture.
2. Matched comparison: ALM
The mean lean soft tissue mass of the arm was 3.811 kg and 3.370 kg in the DRF and control groups, respectively, with significant difference (P=0.000). The mean lean body mass of the leg was 10.859 kg and 10.984 kg in the DRF and control groups, respectively, without significant difference (P=0.606). The relative overall ALM was not significantly different between groups (DRF, 6.093 kg/m2; control, 5.945 kg/m2; P=0.189) (Fig. 4). Seventeen out of 87 patients (19.5%) in the DRF group were diagnosed with sarcopenia based on the Asian diagnostic criteria, compared with 20 individuals (23.0%) in the control group; this difference was not significant by the χ2 test (P=0.711).
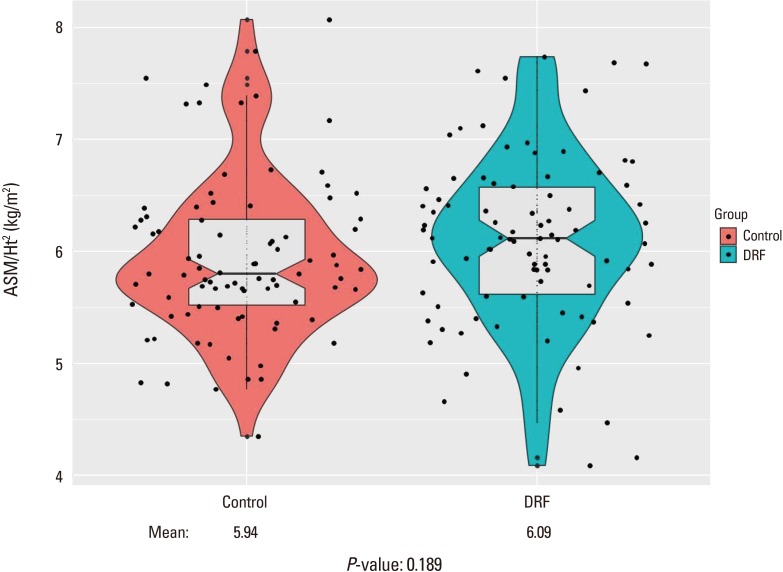
Comparison of appendicular skeletal mass (ASM) divided by height squared, without significance (P=0.189). Ht, height; DRF, distal radius fracture.
DISCUSSION
In our study comparing DRF patients with matched control group through propensity score matching, DRF patients presented significant lower T-score (DRF, −2.42; control, −2.05; P=0.028) and subsequent more prevalence of osteoporosis (DRF, 44 [50.6%] vs. control, 29 [33.3%]; P=0.004). However, there was no significant difference in muscle mass comparison between the two groups (DRF, 6.093 kg/m2; control, 5.945 kg/m2; P=0.189). Finally, overall sarcopenia diagnostic rate also did not have significant difference (DRF, 17 [19.5%] vs. control, 20 [23.0%]; P=0.711).
The concept of skeletal muscle mass reduction with age has recently drawn attention and growing studies were conducted in diverse area. Although the aging process is a definite cause of sarcopenia, other reasons for sarcopenia have been reported, including reduced mobility, inadequate nutrition, neurodegenerative diseases, malignancy, chronic renal and endocrine disorders (mainly diabetes, abnormal thyroid function and low levels of vitamin D, sex steroids, growth hormone and insulin-like growth factor-1), cardiometabolic disease, and nutritional deficiency.[141516] Our study attempted to identify those confounding factors.
There are several tools available for the measurement of muscle mass, including bioelectrical impedance analysis, DXA, magnetic resonance imaging, and computed tomography.[202122] DXA is relatively inexpensive and easy to access with low radiation exposure. Based on these merits, studies on body mass examination using DXA have been reported.[7921]
We predicted elderly person with greater upper extremity muscle mass may have a reduced risk of DRF, since greater arm muscles could prevent of fall and even might protect the distal radius from fracture. Roh et al.[6] reported an increased prevalence of sarcopenia in patients with DRF compared to variable matched controls. However, our study presented opposite result with statistical significance (P=0.000), the average arm lean body mass of patients with DRF (3.811 kg) was higher than controls (3.370 kg). We did not explain the reason until now. We suspecting it was emerging from different measurement tools.
Landi et al.[23] reported a 3-times greater chance of fall injuries in patients with sarcopenia. Decreased leg skeletal mass, part of ALM, correlates with less mobility, slow gait, and compromised body balance. Yoo et al.[24] conducted a case-control study comparing patients with hip fracture versus non-fracture and demonstrated a higher prevalence of sarcopenia in patients with hip fractures compared with controls. Considering above reports, we assumed people who had less leg muscle mass can have a change of more fall injuries in daily life increasing risk of DRF. In our study, there was no significant difference between the two groups (DRF, 6.093 kg/m2; control, 5.945 kg/m2; P=0.189). Finally, overall ALM and ALM/m2 showed parallel results with upper and lower arm muscle mass consequence.
There was effort of standardization equations in BMD assessment from different DXA since BMD from different DXAs presented substantially different value.[2526] However, a few studies were conducted about commercial difference of DXA in sarcopenia.[2728] Until now, standardization between two dominant commercial was not built. If different measurement DXA tools provide considerable different figures, diagnostic value of sarcopenia should reflect commercial factor.
Osteoporosis is a systemic skeletal disease of low BMD and microarchitectural deterioration with a subsequent increase in bone fragility and susceptibility to fracture.[29] There is no doubt that osteoporosis, a primary cause of fragility fractures, led to osteoporotic fracture.[134] Furthermore, osteoporotic fractures are associated with high morbidity and mortality.[30] The economic cost of osteoporosis related fracture management is rising, and this trend is likely to continue.[31] DRF is one representative osteoporosis related fracture, in addition to fractures of the spine, hip, and humerus. In our study, we confirmed again that BMD is associated with DRF.
There is limitation of our study. BMD and body composite measurement were carried out at a different institution with different instruments, Hologic Inc. and GE Lunar Inc. (Madison, WI, USA). In addition, the ALM is representative of a quantitative aspect of muscle mass. To diagnose sarcopenia, muscle strength and physical performance should be considered as well as appendicular muscle mass, but we did not address this in our study.[14]
Nevertheless, authors investigated the relationship between DRF and sarcopenia, in which previous studies were rarely carried out. Besides authors compared senile and fragile DRF patients with relatively large number. As comparison group, unaffected patients were chosen with age, weight, height, and BMI matching process from 2,124 individuals.
In contrast to the pre-study hypothesis, we did not identify a correlation between sarcopenia and DRF. Further comparative studies with a greater number of patients with DRF are needed. Currently, we recognize BMD as having a stronger correlation with DRF.
CONCLUSION
Patients with DRF did not have significantly lower lean body mass; instead, BMD was significantly lower in patients with DRF than in controls.
ACKNOWLEDGMENT
Database of the Korea National Health and Nutrition Examination Surveys was provided by the Korea Centers for Disease Control and Prevention. The authors would like to thank the Korea Centers for Disease Control and Prevention.
Notes
No potential conflict of interest relevant to this article was reported.