


INTRODUCTION
Osteoporosis is a bone metabolic disease.[1] It is characterized by decreased bone mass density and impaired micro-architecture of bone tissue.[2] It is complicated by increased bone fragility and higher fracture rate and consequently the morbidity and mortality rates of the elderly osteoporotic subjects are high.[3,4]
Many oral presentations of osteoporosis were reported. These oral effects of osteoporosis include loss of teeth,[5] resorption of alveolar bone and diminished its height, reduction of the mandibular inferior cortical width (CW) and temporomandibular joints dysfunction.[2]
Assessment of bone mineral density (BMD) by dual energy X-ray absorptiometry (DXA) was an ideal method for diagnosis of osteoporosis [6] as BMD assessment is a good predictor of fracture risk.[6,7] DXA is an expensive technique and has a limited availability for routine use in postmenopausal osteoporosis screening.[8] For this reason, it is one of the obstacles that interfere with its application as a screening method. Accordingly, panoramic radiography is considered to be a cost-effective, routinely available as a screening method of identifying subjects with high risk of osteoporosis [9] and consequently, confirmation by DXA and biochemical markers.
Mandibular cortical shape and width can be assessed qualitatively and/ or quantitatively. The mandibular radiomorphometric indices include the mandibular cortical index (MCI), the mental index (MI) [10] and panoramic mandibular index (PMI) [1] as well as antegonial index (AI). It is reported that (AI) is correlated with BMD.[11] These panoramic indices are important because they are the daily use of radiographs to assess mandibular condition for dentists. It could be directed to evaluate the bone mineralization state especially in the high-risk group including postmenopausal women as a simple noninvasive technique.[12]
Thus, the main objective of the current work was to assess several panoramic radiomorphometric indices (MCI, MI, PMI, and the AI) with BMD values of the lumbar spine (L1-4), femoral neck and total hip among Saudi postmenopausal women. Moreover, we aimed to evaluate the importance of such indices in the prediction of postmenopausal osteoporosis.
METHODS
1. Study design
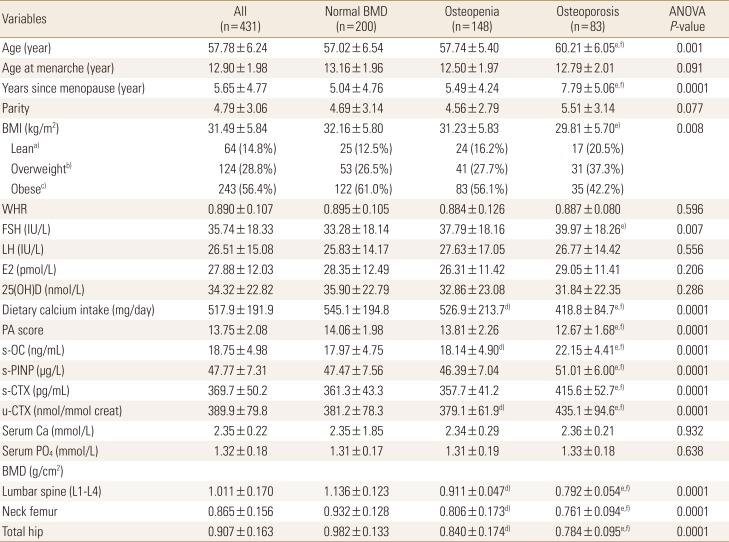
This study was approved by the Human Research Ethical Committee of the Center of Excellence for Osteoporosis Research (CEOR). From January 2009 to December 2011, a total of 431 Saudi women (mean±standard deviation [SD] for age is 57.78±6.24 years) were prospectively recruited in random manner during a health survey from 40 primary health care centers scattered around the city of Jeddah (divided into 7 geographical areas) to ensure that the average health status of the studied group will reflect a randomly selected adult population. Subjects, who agreed to be enrolled in the current study, were asked to visit a special clinic at the CEOR, King Abdulaziz University, Jeddah, Saudi Arabia. Age, body weight, height, body mass index (BMI) calculated as the weight (kg) divided by height (m) squared (kg/m2), and waist-to-hip ratio (WHR) were recorded. All subjects were medically (including dental health examination) examined and interviewed using a locally developed and validated standardized questionnaire to collect information on lifestyle, smoking habits, and level of physical activity in leisure time; and the use of vitamins and medications. Subjects with chronic diseases including osteoarthritis, or with evident endocrine disorders or on any form of drug therapy with the possible effect on bone metabolism (e.g., selective estrogen receptor modulators, calcitonin, phytoestrogens, glucocorticoids, anticonvulsants thyroid hormones, and/or estrogen therapy) or with any type of cancer were excluded from the final analysis. Subjects who are smokers or reported a recent fracture (within 2 years) or osseous lesions in the mandibles were also excluded. In addition, all participants in the present study showed: (1) normal blood counts; and (2) normal renal and hepatic function tests. Women were included if they had experienced their last menstrual cycle at least one year before and were not taking any medications that are known to affect bone metabolism. The levels of follicle-stimulating hormone (FSH) more than 15 mIU/L is the point of selection of postmenopausal women in the current study. Accordingly, all participants (n=431) live in the Jeddah area, participated in the present study and included in the final analysis. Demographic characteristics, hormones together with BMD values for these women are presented in Table 1.
2. Bone mineral densitometry measurements
BMD (g/cm2) was determined for the anteroposterior lumbar spine (L1-4) and mean of proximal right and left femur (total and sub-regions) by DXA using (Lunar Prodigy Advance; GE Lunar, Madison, WI, USA), according to standard protocol. Quality control procedures were carried out in accordance with the manufacturer's recommendations.[13] BMD values were classified according to World Health Organization criteria: a T-score between −1 and −2.5 is indicative of osteopenia, while a T-score <−2.5 reflects osteoporosis and a T-score >−1 is considered normal.[6]
3. Panoramic indices measurements
Panoramic radiographs were obtained on all women at the time of BMD measurement with a Cranex Tome extraoral panoramic X-ray unit (Soredex, Helsinki, Finland) at 12 mA and 15 sec; the kilovoltage varied between 70 and 80 kV. The film-screen speed was 400. Subjects were positioned in the panoramic unit in a way that the vertical line produced by the unit was aligned with the facial midline and the horizontal line (Frankfort plane) was parallel to the floor. Head alignment and subjects positioning were within the reviewer's standard range of quality. Measurements on radiographs with processing artifacts were realized only on the unaffected area of the radiograph.
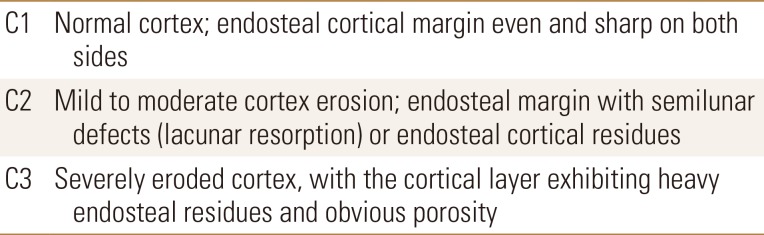
The following radiomorphometric indices were determined bilaterally on each panoramic radiograph. MCI is a qualitative index based on the shape of the mandibular inferior cortex (MIC), distally to mental foramen in both sides of the bone. Patients are classified into 3 groups (C1-3) according to the inferior cortex's shape as described by the Klemetti et al.[14]. It is presented in Table 2: C1 (normal cortex): the endosteal margin of the cortex was even and sharp on both sides; C2 (mildly or moderate eroded cortex): the endosteal margin showed semilunar defect (lacunar resorption) and/or appeared to form endosteal cortical residues on both sides; or C3 (severely eroded cortex): the cortical layer formed heavy endosteal cortical residues and was clearly porous.
The MI describes the measurement of the CW at the mental foramen region, according to the technique previously described by Taguchi et al.[15]. A line parallel to the long axis of the mandible and tangential to the inferior border of the mandible was drawn. A line perpendicular to this tangent intersecting the inferior border of the mental foramen was constructed. Along which mandibular CW (MCW) was measured with a digital caliper. The PMI was measured as the ratio between the MI and the distance between the inferior margin of the mental foramen and the inferior border of the mandibular cortex (line B/line A).[16] The AI describes the measurement of the CW in the region anterior to the gonion at a point identified by extending a “best fit” line along the anterior border from the ascending ramus down to the lower border of the mandible.[11]
MIC classifications and other indices were assessed on dental panoramic radiographs by a dentist with more than 10 years experience in panoramic radiography. Panoramic radiographic assessments were digitized with digital calipers (Absolute Digimatic; Mitutoyo Corp., Kawasaki, Japan). All measurements were performed with observers blinded to the values of BMD and the diagnosis of osteoporosis.
4. Biochemical investigation
1) Sampling
Fasting venous blood samples (8-12 hr fasting) were withdrawn from each participant under standardized conditions. Serum and plasma samples were prepared and stored at −80℃ within 30 min until analyzed for the determinations of various biochemical analytes together with hormones.
2) Measurements of hormones and other analytes
Serum FSH, luteinizing hormone (LH), estradiol (E2) and intact-parathyroid hormone (intact-PTH) were measured by commercially available immunoassays using Elecsys autoanalyzer (Roche Diagnostics GmbH, Mannheim, Germany). The intra- and inter-assay coefficient of variation (CV) were less than 4.0%. Serum 25-hydroxy-vitamin D (25[OH]D) was measured by direct competitive chemiluminescence immunoassay using LIASON autoanalyzer (DiaSorin Inc., Stillwater, MN,. USA). The intra- and inter-assay CVs were 7.8% and 3.8% respectively. Serum creatinine, calcium, and phosphate, together with other biochemical analytes were measured by kits and reagents supplied by Ortho-Clinical Diagnostics (Johnson & Johnson, Rochester, NY, USA) using Vitros 250 Chemistry System Autoanalyzer (Ortho-Clinical Diagnostics; Johnson & Johnson). Moreover, serum intact-osteocalcin (s-OC), serum procollagen type I N-terminal propeptide (s-PINP) and serum cross-linked C-terminal telopeptide of type 1 collagen (s-CTX) were measured as described previously.[17]
3) Intra- and inter-observer agreement
To quantify intra-observer agreements, 50 panoramic radiographs were randomly selected from the sample studied and examined twice by the main observer. There was a period of 4 weeks between readings. Another observer also analyzed the same radiographs to verify inter-observer reliability. Both observers were not aware of the DXA results and had no access to participants' data (e.g., age).
A paired 2-tailed t-test was used to assess the difference in measurements between the left and right sides of the mandible, together with the intra- and inter-observer differences. For the qualitative indices, agreements were calculated as a Cohen κ index; with a P-value <0.05 considered statistically significant.
5. Statistical analysis
Sample size was calculated using PASS software version 11.0.8 (PASS software; NCSS, Kaysville, UT, USA). Data were analyzed using SPSS-Statistical Package (version 15.0; SPSS Inc., Chicago, IL, USA) Results that were not normally distributed were log-transformed before analysis. Associations between continuous variables were examined by Pearson's correlation coefficient. Associations of the qualitative indices with BMD values were examined using a χ2 test. One-way analysis of variance (ANOVA) was used to examine differences among the groups for different variables, followed by post-hoc test and the Bonferroni criterion was used when significance tests were made. The inter-observer agreement for numerical data was performed with Cronbach's α reliability coefficient. The κ statistic was used to measure inter-observer agreement for qualitative data. The receiver-operator curve (ROC) analysis was used to determine the validity of the various panoramic indices studied in the diagnosis of osteopenia and osteoporosis as confirmed by BMD measurements. ROC curve analysis for use of mandibular cortical width (MCW), panoramic mandibular index (PMI), and maxillary-mandibular ratio (M/M ratio) is mainly used to differentiate women with osteoporosis or osteopenia from normal subjects.
RESULTS
Four hundred and thirty-one postmenopausal women were enrolled in the current study. They were classified according to their BMD into three groups; 200 female subjects with normal BMD parameters, 148 osteopenic and 83 osteoporotic women. The demographic data are presented in Table 1. The mean age of the all studied group is 57.8 years. The osteoporosis group showed significantly higher age than the other 2 groups (mean±SD, 60.21±6.05 years, P=0.001). There is no significant difference in the age of menarche while the number of years since menopause is significantly higher in the osteoporotic group than the normal subjects and osteopenic groups (P<0.001).
Surprisingly, BMI is significantly low in the osteoporotic group but there is no significant difference in WHR between the studied groups.
Regarding the biochemical parameters measured and listed in Table 1, there is no significant difference in serum levels of LH, E2, calcium, phosphate, and 25(OH)D between the studied groups. The only hormone that showed the higher level in the osteoporotic group when compared with the other 2 groups is serum FSH level (P=0.007). Moreover, s-OC, serum C-terminal propeptide of procollagen type I, s-PINP, s-CTX, and uterine CTX (u-CTX) are significantly higher in the group of osteoporosis than the normal group and osteopenia group. Also, there are higher in the osteopenic group in contrast to the normal subjects group.
The evaluated BMD parameters (lumbar spine, neck femur, and total hip) proved that BMD parameters are lower in the group of osteoporosis than the other 2 groups. Also, they are lower in the group of osteopenia in contrast to the normal group.
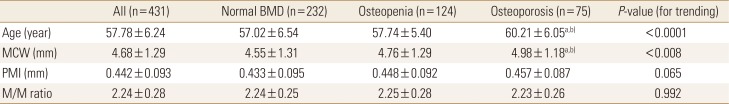
The panoramic indices of the postmenopausal women groups are presented in Table 3. MCW is significantly lower in osteoporosis and osteopenia groups than the control group. Moreover, osteoporosis showed a significantly lower result in comparison to the osteopenia group (P=0.008). While PMI and M/M ratio showed nonsignificant differences between the studied groups (P=0.065, P=0.992 respectively).
The κ indices for the intra-observer agreement were 0.810-0.906 and 0.793-0.890 for the MIC classification, respectively and P<0.05. Intra- and inter-observer agreements were determined for the MI, antegonial depth, and antegonial angle; however, only the measurements and classifications of the main observer were used to analyze all parameters.
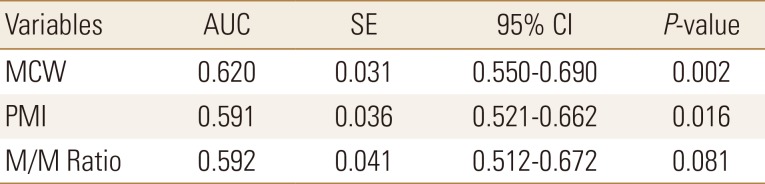
The results of ROC curve analysis is presented in Table 4. As MCW and PMI showed significant data (P=0.002, P=0.016 respectively) while M/M ratio is non-significant (P=0.081).
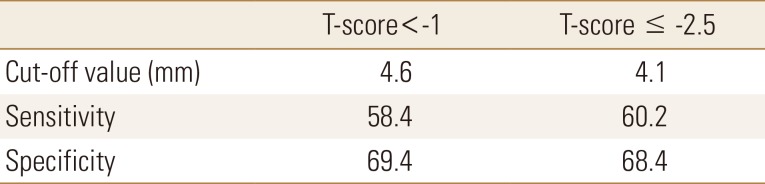
Cut off values of 4.6 at T score <−1 and 4.1 at T score ≤−2.5 were used. The sensitivity and specificity of MCW for assessment of osteoporosis were presented in Table 5. It showed 58.4% sensitivity and 69.4 % specificity at a cut off value 4.6 mm with T score <−1.
DISCUSSION
Osteoporosis is a silent metabolic bone disease. It is commonly presented by a complication in the form of spontaneous or minor trauma induced fracture. Femur neck, vertebrae, and forearm are the most common site affected.[18] Radiologic examination of the mandible and oral cavity is considered the easiest commonly used radiologic test that can predict, diagnose or even follow up on any defect in bone mineralization.[19] So, in the current study, our first objective was to investigate the use of panoramic radiomorphometric indices alone or in combination with BMD measurement in prediction of osteoporosis in postmenopausal Saudi women.
Since age and sex are prominent factors that determine and affect the bone mineralization state,[20] the current study is mainly directed to a sample of postmenopausal women in Saudi Arabia to focus only on those individuals with osteoporosis in our study. The age of osteoporotic patients is significantly higher than that of the other 2 groups. Moreover, the number of years elapsed from menopause is also considered as a risk factor. These results coincide with data presented by Dagistan and Bilge [20], Alonso et al.[21].
BMD, the standard method for predicting and diagnosis of osteoporosis in spite of its unavailability and expensiveness [22] is the tool used in the current study. It revealed that all parameters of BMD (lumbar spine, neck femur, and total hip) are reduced in the group of osteoporosis than the other 2 groups. Also, they are lower in the group of osteopenia in contrast to the normal group.
It is also confirmed by measuring the biochemical bone markers (s-OC, s-PINP, s-CTX, u-CTX, Serum Calcium, and phosphate). The role of these biochemical markers in the diagnosis of osteoporosis as well as prediction of bone loss and even risk of fracture in both men and women is reported by Bauer et al.[23], Hlaing and Compston [24].
It was previously suggested that biochemical markers of bone turnover could be used to identify fast bone losers. Several cross-sectional studies indicated that bone turnover rate and high bone turnover are sustained long after the menopause as assessed by biochemical markers. Löfman et al.[25] reported that bone turnover biochemical markers were related to the current bone mass and could provide information about future bone loss. Baxter et al. [26] referred that N-terminal telopeptide of collagen type I (NTx) was considered the most sensitive, of the biochemical markers of bone resorption, to menopausal status. Moreover, an inverse relationship between NTx, alkaline phosphatase (ALP), and BMD was reported by Wheater et al. [27]. Greenblatt et al.[28] concluded that increased levels of bone turnover biochemical markers are associated with greater radial bone loss and that high levels of all bone markers except serum bone ALP are associated with faster bone loss. Rosen et al.[29] concluded that markers of bone formation and resorption can be used to predict future BMD clinically in postmenopausal women and that urinary NTx provided the greatest sensitivity and specificity for change in bone density.
However, other studies have failed to prove that a significant difference in biochemical markers of bone turnover exists between osteoporotic and control subjects. Burch et al.[30] concluded that assessment of bone turnover cannot help predict the severity of bone loss, but it can be useful in selecting and monitoring the proper therapeutic approach. In a study of Cosman et al.[31] measurement of individual serum and urine markers of bone turnover cannot predict bone loss in spine and hip; however, a combination of demographic and biochemical variables could predict the risk of fracture in untreated postmenopausal women. So, the combined BMD and biochemical bone marker assessment is better in prediction, diagnosis and even grading the degree of osteoporosis.
As the oral cavity and mandibles are frequently examined radiographic more than other parts of the body by dentists, it could be a beneficial easy noninvasive rapid test for prediction and diagnosis of osteoporosis.[12] So, in the present study, we focused on a sample of high-risk group (postmenopausal women) in Saudi Arabia. We measured some of the panoramic indices and found a significant reduction in MCW in osteoporosis and osteopenia groups than the control group and in osteoporosis in comparison to the osteopenia group. While there is no significant difference is found regarding the other measured 2 panoramic indices (PMI and M/M) between the studied groups.
The changes in bone mineralization could be detected early on dental radiographs. It is explained by the fact that bone formation rate is high during the mandibular alveolar process.[32] In agreement with our study, Kavitha et al. [33] suggested that MCW is significantly associated with age and could be considered as a valuable parameter for evaluating the bone strength and osteoporosis regarding postmenopausal women in their study on Korean population. Moreover, Roberts et al.[34] reported that MCW starts to decrease in women and men at ages 42.5 and 36 years, respectively. But the rate of reduction is significantly higher in female than males (13.4%, 5.4% respectively). Nearly similar results were reported previously in Indian,[2] Brazilian [35], and Korean [36] studies.
The possible use of MCW as a predictor of osteoporosis is tested by ROC curve analysis. It revealed significant results with sensitivity and specificity (58.4% and 69.4% respectively) at a cut off level 4.6 mm at T-score <−1 and (60.2% and 68.4% respectively) at a cut off level 4.1 mm at T-score ≤−2.5. These data are indicative of the possible use of MCW as a predictor test of osteoporosis in postmenopausal women. While, The conclusive nonsignificant values of PMI and M/M ratio that are presented in our study indicates that they are of low or even no significant values in detecting or diagnosing osteoporosis in postmenopausal Saudi women. These data coincide with that presented previously by Benson et al.[37], White et al.[38] and Bhatnagar et al.[2].
CONCLUSIONS
From the current study, it could be concluded that MCW as an important panoramic radiographic parameter can be used for prediction and diagnosis of osteoporosis in postmenopausal Saudi women with low BMD. The use of MCW in prediction and follow up is satisfactory but the combined use of both parameters is recommended for diagnosing osteoporosis.
 PDF Links
 PubReader
 ePub Link
 Full text via DOI
 Full text via PMC
 Download Citation
 Print
Print