Association of Insulin Resistance with Lower Bone Volume and Strength Index of the Proximal Femur in Nondiabetic Postmenopausal Women
Article information
Abstract
Background
Type 2 diabetes mellitus is associated with an increased risk of osteoporotic fracture despite relatively preserved bone mineral density (BMD). Although this paradox might be attributed to the influence of insulin resistance (IR) on bone structure and material properties, the association of IR with femur bone geometry and strength indices remains unclear.
Methods
Using data from the Cardiovascular and Metabolic Disease Etiology Research Center cohort study, we conducted a cross-sectional analysis among nondiabetic postmenopausal women. IR was estimated using the homeostasis model assessment of IR (HOMA-IR). Compartment-specific volumetric BMD (vBMD) and bone volume of proximal femur were measured using quantitative computed tomography. The compressive strength index (CSI), section modulus (Z), and buckling ratio of the femoral neck were calculated as bone strength indices.
Results
Among 1,008 subjects (mean age, 57.3 years; body mass index [BMI], 23.6 kg/m2), BMI, waist circumference, and vBMD of the femoral neck and total hip increased in a linear trend from the lowest (<1.37) to highest (≥2.27) HOMA-IR quartile (P<0.05 for all). The HOMA-IR showed an independent negative association with total bone volume (standardized β=−0.12), cortical volume (β=−0.05), CSI (β=−0.013), and Z (β=−0.017; P<0.05 for all) of the femoral neck after adjustment for age, weight, height, physical activity, and vitamin D and high-sensitivity C-reactive protein levels. However, the association between HOMA-IR and vBMD was attenuated in the adjusted model (femoral neck, β=0.94; P=0.548).
Conclusions
Elevated HOMA-IR was associated with lower cortical bone volume and bone strength indices in nondiabetic postmenopausal women, independent of age and body size.
INTRODUCTION
Presence of type 2 diabetes mellitus (T2DM) is associated with an increased risk of fracture, which lead to substantial increase of disability and mortality in women.[1] Large cohort studies demonstrated that women with diabetes had about two-fold increased risk of hip fracture compared to women without diabetes after controlling for areal bone mineral density (BMD) measured by dual energy X-ray absorptiometry (DXA).[2345] Notably, women with diabetes had greater BMD at hip and spine compared to those without diabetes.[46] These paradoxical findings suggest that BMD might not adequately reflect bone fragility in individuals with T2DM, which lead to the concept that insulin resistance (IR) might in part directly contribute to deficit of bone structure and material quality rather than BMD.[7]
In a recent study using high-resolution peripheral quantitative computed tomography (QCT), IR was associated with smaller bone size and greater volumetric BMD (vBMD) at the radius and tibia.[8] In another cohort consisted of 717 middle-aged men and women, greater homeostasis model assessment of IR (HOMA-IR) was associated with lower femoral neck strength indices derived from 2-dimensional DXA data.[9] However, data on the association of IR with 3-dimensional geometry and strength indices at proximal femur derived from QCT are limited yet.
In this study, we aimed to examine our hypothesis that elevated IR might be independently associated with lower QCT-derived compartment-specific bone volume and femur neck strength indices in community-dwelling nondiabetic postmenopausal women.
METHODS
1. Study population
This cross-sectional study used baseline data from the Cardiovascular and Metabolic Disease Etiology Research Center (CMERC) cohort study. The detailed study design of CMERC study was reported elsewhere.[10] Briefly, a total of 2,178 women aged 30 to 64 years participated in the CMERC study during the baseline health examination from 2013 to 2015. Participants included a free-living general population residing in four districts (Seoul, Goyang, Gimpo, and Incheon), South Korea. This study has been approved by the Institutional Review Board of Severance Hospital, Yonsei University Health System, Seoul, Korea (4-2013-0661). Written informed consent was obtained from all participants prior to the enrollment. For this analysis, participants with age less than 50 years or those who had any menstrual flow within the preceding 12 months (n=847) were excluded and 1,331 postmenopausal women aged 50 or older were remained (Fig. 1). Subjects with diabetes (defined as using any anti-diabetic medications or hemoglobin A1c [HbA1c] ≥6.5%; n=123), on any osteoporosis treatment (n=64), current glucocorticoid use (n=2) or estrogen replacement therapy (n=129), liver cirrhosis (n=1), and those without fasting glucose or insulin level (n=2) or QCT measurements (n=2) were further excluded and a total of 1,008 subjects were eligible for the final analysis. All participants underwent interviewer-assisted questionnaire for medical history, medication uses, and health-related behaviors. Physical activity (PA) was evaluated using International PA Questionnaire-Short Form.[11]
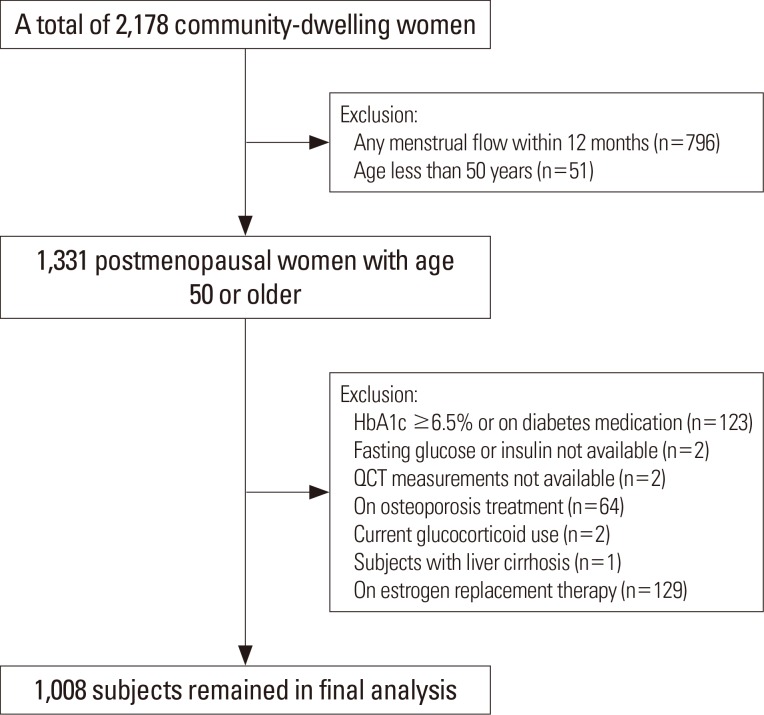
Study flow diagram. HbA1c, hemoglobin A1c; QCT, quantitative computed tomography.
2. Anthropometry measurements
Every participant's height and body weight were measured while they wore light clothing, without shoes or accessories. Height was measured within 0.1 cm using a stadiometer while with an upright position (Jenix, Seoul, Korea). Body weight was determined within 0.1 kg using an electronic scale (CAS, Seongnam, Korea). Body mass index (BMI) was calculated as body weight in kilograms divided by standing height in square meters. Waist circumference was measured over the midpoint between the lower border of the ribs and iliac crest in the mid-axillary plane. Mid-thigh circumference was measured at the midpoint between the inguinal crease of the right leg and the proximal border of the patella in a standing position.
3. Laboratory assays
Blood samples were collected from the antecubital vein after over 8 hr on fasting. All analyses were performed at a single laboratory center (Seoul Clinical Laboratories R&D Center, Seoul, Korea). Fasting blood glucose and creatinine level was determined by a colorimetry method (ADVIA 1800; Siemens, Tarrytown, NY, USA). HbA1c was determined using high-performance liquid chromatography with a Variant II Turbo (Bio-Rad Laboratories, Hercules, CA, USA). Fasting insulin levels were determined by a radioimmunoassay with SR-300 apparatus (Stratec; Birkenfeld, Rhineland-Palatinate, Germany). HOMA-IR was used to evaluate IR: HOMA-IR=fasting glucose (mg/dL)×fasting insulin (µIU/mL)/405.[12] Total cholesterol, high-density lipoprotein (HDL) cholesterol, low-density lipoprotein (LDL) cholesterol, and high-sensitivity C-reactive protein (hs-CRP) levels were assayed by enzymatic methods (ADVIA 1800; Siemens). Serum 25-hydroxy-vitamin D (25[OH]D) level was assessed by a chemiluminescence immunoassay (DiaSorin, Dietzenbach, Germany). The Chronic Kidney Disease-Epidemiology equation was used to calculate the estimated glomerular filtration rate.[13]
4. QCT-derived bone parameters
Subjects were scanned on a Somatom Definition AS+128 channel computed tomography (CT; Siemens Healthcare, Forchheim, Germany), a Somatom sensation 64 channel CT (Siemens Healthcare), or a General Electric (GE) LightSpeed VCT apparatus (GE Medical System, Milwaukee, WI, USA) at 120 kVp, 150 mAs using a 50-cm scan field-of-view. A liquid dipotassium phosphate (K2HPO4) phantom (Model 3; Mindways Software, Austin, TX, USA) was included in each scan to prevent scanner drift and to calculate vBMD. CT images obtained at lumbar spine (L1-2) and proximal femur were reconstructed with a standard body reconstruction algorithm at 3-mm slick thickness, in-plane pixel size 512×512, and display field-of-view 250 mm. All scanned data were analyzed using QCTPro software (Mindways Software Inc., Austin, TX, USA). Lumbar vBMD was calculated as the average vBMD of L1 and L2. Bone volume and vBMD were estimated in total proximal femur or as divided by femur neck, trochanter, and intertrochanter. Corrected bone volume estimates for potential partial volume effect was used in the analysis. Each pixel was further classified as representative of either cortical or trabecular compartment of bone using a cortical threshold of 350 mg/cm3. Indices of axial compression (compressive stress index, compressive strength index [CSI]), bending stress (section modulus, Z), and buckling ratio (BR) of femur neck area were calculated using modified simple strength indices equations as follows: CSI=A/F where A is (projected areal femur neck BMD×femur neck width)/(cortical vBMD×104) and F is body weight multiplied by 9.8 m/s2; Z=(projected areal femur neck BMD×femur neck width2)/(cortical vBMD×107).[14] CSI and Z was rescaled to mm2/N and cm3, respectively. BR was estimated as enclosed total bone volume/cortical bone volume of femur neck.[1516]
5. Statistical analysis
Data were presented as mean±standard deviation (SD) or median (interquartile rages) for continuous variables and as numbers (percentages) for categorical variables. Trends in clinical characteristics according to quartiles of HOMA-IR were examined using Cuzick's test [17] for continuous variables and Cochrane-Amitage test for categorical variables. Due to right-skewed distribution, HOMA-IR and hs-CRP level were entered to models as log-transformed unit. The mean difference of QCT-derived bone volume and vBMD at proximal femur between top two HOMA-IR quartiles and bottom two quartiles were expressed in SD scores as divided by the SD of the bottom two quartile groups after adjustment for age, weight, and height using analysis of covariance. For femur neck bone strength indices, the mean difference between HOMA-IR quartiles were expressed in standardized deviation score compared to the lowest quartile as a reference group. Multivariate regression analyses were performed to examine the independent association of IR with bone geometry and strength indices after adjustment for age, height, and weight (model 1); thigh and waist circumference instead of weight from model 1 (model 2); and additional adjustment for current smoking, alcohol intake, PA, vitamin D, and log-transformed hs-CRP status (model 3). All statistical analyses were performed with STATA 14.2 (Stata Corp., College Station, TX, USA). Statistical significance was defined as a two-sided P-value less than 0.05.
RESULTS
1. Characteristics of study participants
The baseline characteristics of 1,008 participants according to HOMA-IR quartiles are presented in Table 1. The mean age and BMI of study participants was 57.3 years and 23.6 kg/m2, respectively. Median HOMA-IR value was 1.74 with interquartile range of 1.37 to 2.27. Increasing trend was observed for mean age, weight, BMI, waist circumference, fasting glucose, insulin, and median hs-CRP level from lowest to highest HOMA-IR quartile (P<0.001 for all). However, no significant difference was observed in PA, serum 25(OH)D and glomerular filtration rate levels across HOMA-IR quartiles. Among the QCT-derived bone parameters, vBMD of trochanter, intertrochanter, and total proximal femur increased in higher HOMA-IR quartiles compared to lower quartiles, whereas vBMD of lumbar spine and unadjusted femur geometry indices did not differ significantly among HOMA-IR quartiles.
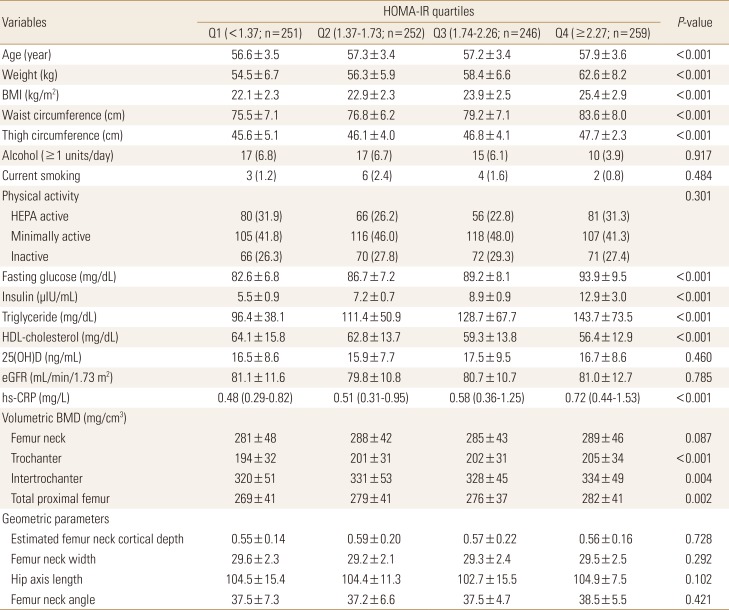
Characteristics of study participants according to quartiles of homeostasis model assessment of insulin resistance
2. Bone geometry parameters between low and high HOMA-IR groups
Women in the top two HOMA-IR quartiles (HOMA-IR≥1.74) had lower total and cortical bone volume at femur neck, trochanter, intertrochanter, and total proximal hip compared with the women in the bottom two quartiles after adjustment for age, weight, and height (Fig. 2). The decrease in total bone volume was largely driven by lower cortical bone volume. Trabecular bone volume at proximal femur did not differ significantly between high and low HOMA-IR quartile groups. Although greater vBMD of both cortical and trabecular compartment at total proximal femur and femur neck was observed in women in high HOMA-IR quartiles compared with low HOMA-IR quartiles (unadjusted P<0.05 for all), the positive association with HOMA-IR remained robust only for cortical vBMD after adjustment for age, weight, and height.

Standardized difference (in standard deviation [SD] units±95% confidence interval) in quantitative computed tomography-derived bone volume and density at proximal femur for subjects in the top quartiles of homeostasis model assessment of insulin resistance (HOMA-IR) vs. lower quartiles after adjustment for age, weight, and height. Dashed line indicates the mean of the bottom two quartiles. The mean difference between the groups were expressed in SD scores as divided by the SD of the bottom two quartile group. Asterisk (*) indicated P<0.05 for the difference between the top and bottom two quartiles. vBMD, volumetric bone mineral density.
3. Bone strength indices across HOMA-IR quartiles
Compared to the mean value in the lowest HOMA-IR quartile, mean difference of bone strength indices adjusted for age, weight, and height across HOMA-IR quartiles were plotted using SD score as divided by the standard deviation of the lowest HOMA-IR quartile group (Fig. 3). Bone strength surrogates for CSI and bending stress (Z) decreased in stepwise fashion from lowest to highest HOMA-IR quartiles. The mean difference of strength indices reached statistical significance in highest quartile for both CSI (Q4 vs. Q1; SD score, −0.21; P=0.024) and Z (Q4 vs. Q1; SD score, −0.23; P=0.011), whereas propensity for BR was not altered significantly (Q4 vs. Q1; SD score, −0.01; P=0.894) except slight decrease in BR in Q2 (SD score, −0.40; P=0.001).
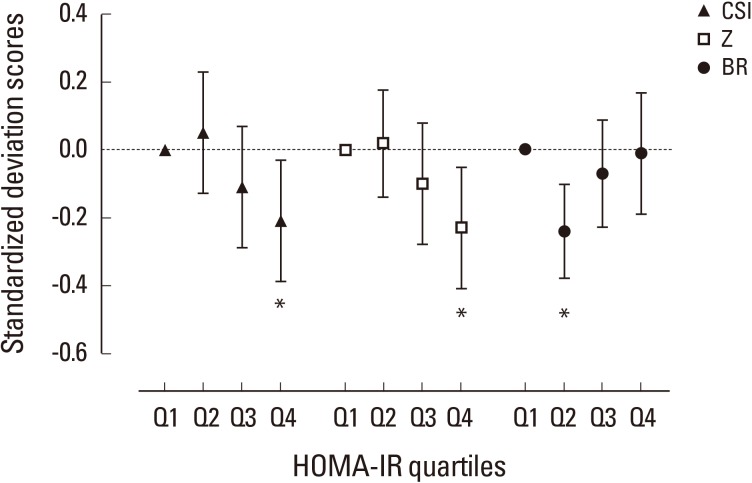
Standardized difference (in standard deviation [SD] units±95% confidence interval) in quantitative computed tomography-derived bone geometry parameters at femur according to homeostasis model assessment of insulin resistance (HOMA-IR) quartiles. Dashed line indicates the mean value of the subjects in lowest quartile after adjustment for age, weight, and height. The mean difference between the groups were expressed in SD scores as divided by the SD of the lowest quartile group. Asterisk (*) indicated P<0.05 as compared with the lowest quartile as reference group. Q, quartile; CSI, compressive strength index; Z, section modulus; BR, buckling ratio.
4. Association of HOMA-IR with bone geometry and strength parameters
Table 2 present the association between log-transformed HOMA-IR and bone parameters in multivariate linear regression models. Log-transformed HOMA-IR showed negative association with total and cortical bone volume at femur neck, trochanter, intertrochanter, and total proximal femur after adjustment for age, weight, and height (model 1). The negative association of HOMA-IR with total bone volume remained robust when waist circumference and thigh circumference entered into multivariate model instead of body weight (model 2). In model 2, the association with cortical volume was attenuated in trochanter, intertrochanter, and total proximal femur, whereas the negative association remained significant in femur neck. HOMA-IR showed positive association with cortical vBMD in both model 1 and model 2, whereas the association with total bone or trabecular vBMD did not reach statistical significance. Estimated cortical depth and bone strength surrogates (CSI and Z) were negatively associated with log-transformed HOMA-IR but BR did not show any significant linear association. Further adjustment for smoking, alcohol intake, PA, vitamin D and log-transformed hs-CRP level (model 3) did not alter the results observed in model 2.

Association of homeostasis model assessment of insulin resistance with bone geometry parameters
DISCUSSION
In this population-based study, we found that IR was associated with lower bone volume, particularly in cortical compartment, lower estimated cortical depth, and higher cortical vBMD in nondiabetic postmenopausal women. Higher IR was also associated with lower bone strength indices derived from QCT measures. The association of high IR with low bone volume and bone strength indices of femur neck remained independent even after adjustment for age, weight, height, PA, vitamin D and hs-CRP level.
Despite the well-established association between presence of diabetes and elevated fracture risk, independent influence of IR on bone remains unclear.[1819] Several studies pointed the greater BMD in axial bone in subjects with hyperinsulinemia, which was consistent with our findings that women in higher HOMA-IR quartiles had greater proximal femur vBMD, particularly in cortical compartment. [820] Our findings also align with a few studies which showed the association of IR with small bone size at lumbar spine, tibia, or proximal femur.[81821] In this study, mean difference of cortical volume was evident, in accordance with the notion from previous studies that type 2 diabetes was associated with cortical bone size deficit.[722] In line with a previous study using DXA data, we observed that QCT-derived bone strength indices of femur neck was significantly lower in women with higher HOMA-IR level, independent of age, body weight, height, and other potential covariates.[9] Given the known elevated risk of fracture in patients with type 2 diabetes, this suggest that the negative effect on bone strength indices due to lower cortical bone volume has offset the apparently favorable effect in vBMD associated with IR, which might in part contribute to increased propensity for future fracture.[719]
Several mechanisms can be postulated for the inverse association between IR and bone volume. Excess body fat, especially visceral fat, was negatively associated with femur cross-sectional area, cortical bone area, and polar moment in young premenopausal women and obese men.[232425] Altered adipokine secretion pattern, elevated inflammatory cytokine, and reduced 25(OH)D status might contribute to poor bone geometry, all of which are associated with excess body fat and IR.[21] Mechanical strain generated by muscle also plays important role in determining bone geometry.[2627] Muscle function and size are known to be negatively associated with IR, even in nondiabetic subjects.[28] However, in our study, the inverse association between HOMA-IR and bone volume in this study was attenuated but not completely lost even after further adjustment for waist and thigh circumference as surrogates for fat mass and muscle mass, PA, vitamin D and hs-CRP level. Therefore, the association between IR and low bone volume might not be fully mediated by indirect effects via excess fat mass and decreased muscle mass, which support the potential direct effect of IR on bone volume determination.[2930]
Although high cortical vBMD and low cortical bone volume in women with high HOMA-IR level seem to be contradictory, data from patients with anorexia nervosa (AN) may provide a basis for interpreting the discrepancy between bone size and vBMD shown in related studies including our data.[31] Among untreated AN, who received with estrogen replacement therapy, and who recovered from AN, energy deprivation largely contributed to reduced bone size, whereas estrogen deficiency mainly accounted for reduced vBMD, indicating that vBMD and bone size might be modulated by distinctive factors. Based on these findings, it is conceivable that periosteal apposition might be mainly influenced by impaired insulin signaling in osteoblast resulting in a lower cortical bone volume, whereas elevated estrogen from excess fat mass or increased mechanical strain from relatively heavy weight associated with IR may exert beneficial effect on vBMD as observed in our study, possibly via reduced bone turnover rate.[3132] Although distinctive association of IR with cortical bone impairment has not been fully elucidated yet, childhood and adolescent studies proposed the impaired IGF-1 dependent cortical bone development by high IR as a potential underlying mechanism.[3334] In line with these findings, impaired subperiosteal expansion combined with impaired endosteal apposition and lack of adaptive response to mechanical loading was observed in insulin-like growth factor I (IGF-1) deficient mice model throughout the aging process, whereas trabecular bone acquisition or architecture was relatively spared.[35] Thus, a reduction in circulating IGF-1 may be one of the possible explanations for the negative association between IR and cortical volume, although serum IGF-1 level was not available in this study. Further experimental research is needed to clarify the underlying mechanisms.
This study has several strengths including large number of well-defined community-dwelling subjects and QCT-measured volumetric bone parameters. However, our study is limited by the cross-sectional design which did not allow any inference on causality. Prior studies showed the possible ethnic interaction for association between IR and bone geometry.[8] Because our study participants were confined to postmenopausal Korean women, the findings might not be directly applicable to women with different ethnicity. However, our homogenous nondiabetic participants with relatively lean body weight might have strengthened the association between HOMA-IR and bone geometry observed in this study. Given the resolution of our QCT protocol, the possibility of partial volume effect could not be ruled out despite the use of corrected parameters for potential partial volume effect.[36] Although osteocalcin and other bone turnover markers have been reported to be associated with glucose metabolism, such bone biomarkers were not available in this study.[37] Exact mechanisms of hyperinsulinemia, impaired insulin signaling, and possible differences in insulin sensitivity among bone cells and other organs are not completely understood yet.
CONCLUSIONS
In conclusion, IR was associated with lower cortical bone volume at proximal femur, greater cortical vBMD, and lower bone strength indices at femur neck. Our findings suggest the possibility of the distinct mechanisms for the modulation of bone size and BMD associated with IR in postmenopausal women, which merits further investigations.
ACKNOWLEDGMENT
This study was supported by a grant from the Korea Health Technology R&D Project, funded by the Ministry of Health and Welfare, Republic of Korea (grant number HI13C0715). We thank our study participants and all team members of CMERC cohort study.
Notes
No potential conflict of interest relevant to this article was reported.