Measurement Uncertainty in Spine Bone Mineral Density by Dual Energy X-ray Absorptiometry
Article information
Abstract
Background
The purpose of this study was to calculate the measurement uncertainty of the process of bone mineral density (BMD) analysis using dual energy X-ray absorptiometry with traceability.
Methods
Between March 2015 and October 2016, among healthy participants in their 20s and 30s, the study included those who had not taken calcium, vitamin D supplements and steroids and were without a history of osteoporosis, osteopenia and diseases related to osteoporosis. Relational expression of the model was established based on Guide to the Expression of Uncertainty in Measurements and Eurachem and the uncertainty from each factor was evaluated.
Results
The combined standard uncertainty was 0.015, while the expanded uncertainty was 0.0298. The factor-specific standard uncertainties that occurred in the process of measuring BMD were 0.72% for the calibration curve, 0.9% for the internal quality control (IQC) using Aluminum Spine Phantom, 0.58% for European Spine Phantom (ESP), and 0.9% for the inspector precision (IP).
Conclusions
The combined standard uncertainty of the spine BMD corrected with ESP was 0.015 when measured at one time and targeting one participant. The uncertainties of the accuracy of the IQC and the IP were higher than that of the other factors. Therefore, there will be a need for establishment of protocols to lower these uncertainties.
INTRODUCTION
The importance of the precision medicine has been increasing recently,[12] and due to the advances in medical science, the types of the measurement instruments are also becoming more varied, and their numbers have also been increasing.[34] Among these devices, the ones for diagnosis of osteoporosis are also being improved and their numbers are rising. As such, with the bone mineral density (BMD) measurements being performed more frequently, the controversy and questions over the accuracy of various BMD measuring devices is also increasing.[567]
In general, the quality control on BMD assays using dual energy X-ray absorptiometry (DXA) is done in according to the International Society for Clinical Densitometry (ISCD) guidelines.[7] However, all the errors occurring in these processes concern the reliability of the BMD values.
Recently, measurement uncertainty has been most commonly used in determining the standard value in the field of metrology, and the traceability of the measurement process must be confirmed in order to compare measurement results, for example in a clinical setting, from other patients and other hospitals.[8] However, for among the healthcare providers, the concepts have remained unfamiliar.
The procedure for calculating uncertainty by means of Guide to the Expression of Uncertainty in Measurements (GUM) [9] is for making a statistical estimate through the function expression of the measured quantity, the calculation of the standard uncertainty of the input quantity, the calculation of combined standard uncertainty, and the calculation of expanded uncertainty.[10]
The purpose of this study was to calculate the measurement uncertainty of the process of spine BMD analysis using DXA with traceability.
METHODS
1. Participants
The design and protocol of this prospective study were approved by the Institutional Review Board of our hospital. All participants received informed consent. Between March 2015 and October 2016, among healthy participants in their 20s and 30s, the study included those who had not taken calcium that also included vitamin D supplements and steroids and had no history of osteoporosis, osteopenia and diseases related to osteoporosis.
2. Reference material: European Spine Phantom (ESP)
The ESP is a semi anthropomorphic phantom, comprised of vertebra-like structures of different sizes and densities. Our unit had three vertebrae representing low (L1), medium (L2) and high (L3) densities with actual BMD values of 0.496 g/cm2, 0.990 g/cm2, and 1.499 g/cm2, respectively. The phantom's main body consisted of a water-equivalent resin and three inserts containing varying amounts of calcium hydroxyapatite to cover the full physiological range of spongious and cortical bone densities for all age groups. The container was 260 mm long, 180 mm wide, and 110 mm in height.[61011]
3. DXA
BMD in the lumbar spine was measured with DXA (Lunar Prodigy Advance, GE Lunar, Medison, WI, USA) using standard scanning procedures. The scans were performed by trained technicians and according to the manufacturer's protocol. We aimed to reduce the coefficient of variation (CVsd) to <1.9% (least significant change [LSC]=5.3%) for the lumbar spine measurements.
4. Improving traceability in the spine BMD measurement process
All the BMD measurement processes followed the ISCD guidelines.[812] To evaluate internal precision, each of the 15 subjects were measured 3 times. After the first bone densitometry test, the second and third tests were performed after the participants first got up from the instrument table and then went on the table again to allow for body movement prior to the repeat tests. The measured values were used to produce precision for each part by using the calculation table distributed by ISCD. When the coefficients of variability exceeded 1.9% (LSC=5.3%) according to the standard of ISCD measurement errors, the participants were re-educated and measured again. In addition, traceability for the measurement process was confirmed by conducting an ESP bias evaluation. Mechanical operation and quality of radiation were adjusted by using the block phantom. In order to assess precision, accuracy and functionality of DXA, we assessed and adjusted the quality of radiation, value of tissue equivalent materials and the absorption coefficient. Movements of the equipment were also assessed (Fig. 1).[13]
5. Measurement uncertainty
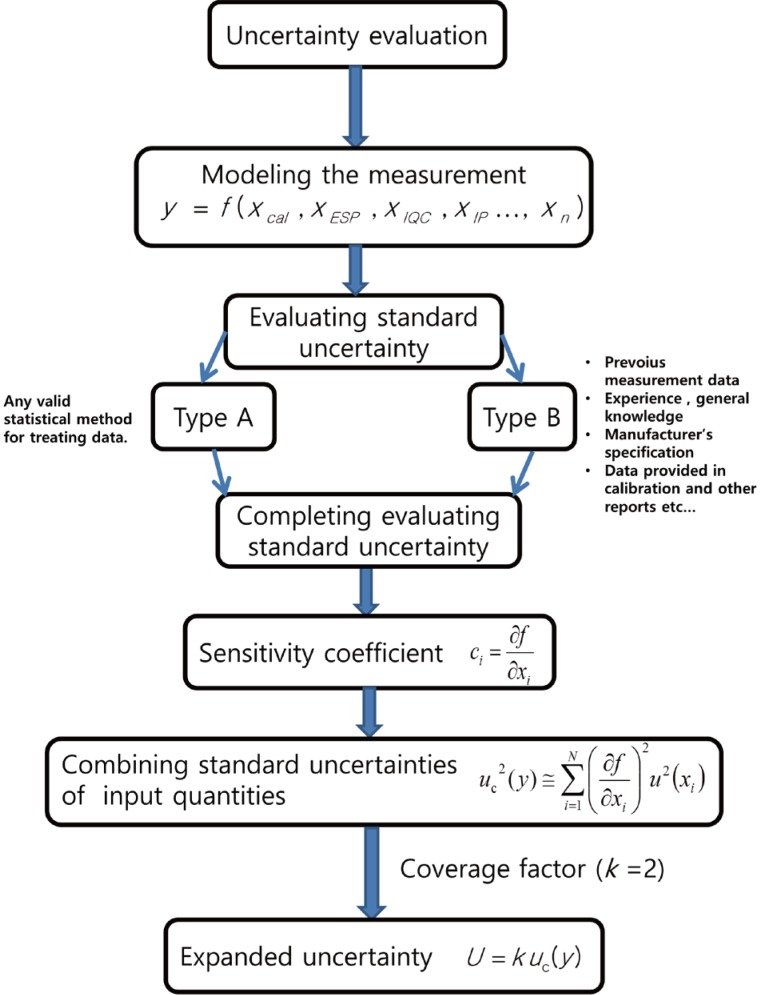
Relational expression of the model was based on GUM and Eurachem and the uncertainty from each of the factors was evaluated (Fig. 2).
6. Modeling the measurement
 (2)
(2)Based on relational expression of the model (1), we selected four factors of uncertainty of measurement, namely Xcal, XESP, XIQC, and XIP (2). Standard uncertainty and combined uncertainty of measurement were also calculated.
7. Measurements of standard uncertainty
Standard uncertainties of calibration curve for ESP, ESP, IQC, and IP were measured. Resolution of the equipment was decided to be ignored in the measurements of standard uncertainty.
8. Standard uncertainty of calibration curve
Mean value and standard deviation were calculated after performing repeated measurements of ESP in DXA. Regression analysis was conducted by setting the assigned value of ESP as the x-axis and the indicated value of equipment after measurement as the y-axis (Fig. 3A). In addition, bias was measured between the assigned value of ESP and the indicated value of equipment (Fig. 3B).
 (3)
(3)9. Standard uncertainty of other uncertainty sources
Standard uncertainty of ESP, IQC and IP were obtained as seen in formula, respectively (4–6).
 (4)
(4) (6)
(6)10. Combined standard uncertainty
When measurements are from multiple entry values, the standard uncertainty of the results of the measurements is called combined standard uncertainty, which is acquired by using the law of propagation of uncertainty (8).[14]
 (8)
(8)11. Coverage factor (k)
In order to obtain the coverage factor k, the effective degree of freedom of the combined standard uncertainty needed to be estimated. This effective freedom is expressed as Veff, which was measured by using the Welch-Satterthwaite formula (9).[1516]
 (9)
(9)12. Expanded uncertainty (U)
Expanded uncertainty was obtained by multiplying the calculated combined standard uncertainty and the inclusion factor k equivalent to confidence level, as seen in formula (10).
13. Statistical analysis
Basic calculation for measurement uncertainty and correlation coefficient were performed using Microsoft Excel 2010 software (Microsoft Corporation, Redmond, WA, USA).
RESULTS
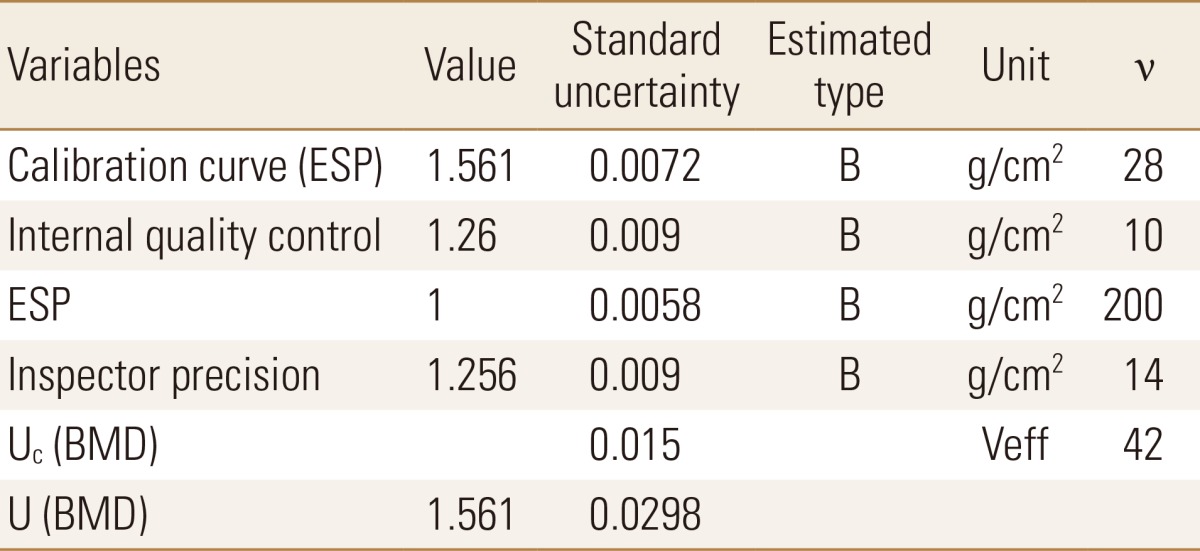
According to the uncertainty calculation formula, standard uncertainty and combined uncertainty for one healthy man in his 20s were acquired. From this analysis, the standard uncertainty of calibration curve was 0.0072, while the standard uncertainties of IQC, ESP and IP were 0.009, 0.0058, and 0.009, respectively. The combined uncertainty based on these results was 0.015, while the expanded uncertainty was 0.0298 (k=2) (Table 1). The uncertainty budget, considering all the sources mentioned above, is presented in Table 1.
DISCUSSION
In this study, spine BMD after being corrected for ESP was measured one time and targeting one participant. The principle findings of our study showed that the combined standard uncertainty was 0.015, while the expanded uncertainty was 0.0298. The factor-specific standard uncertainties that occurred in the process of measuring the spine BMD were 0.72% for calibration curve, 0.9% for IQC using Aluminum Spine Phantom, 0.58% for ESP, and 0.9% for IP. It was found that the IQC and the IP were calculated to be higher than the uncertainty occurring in the process of ESP calibration. From this study, the IQC and the IP were known to have higher uncertainty than other measurement processes. Accuracy was also maintained using calculation of the LSC according to the ISCD guidelines.
Park et al. [5] evaluated discrepancy and standardizations of DXA devices from three manufacturers using a ESP. They reported that mean CVsd for L1–L3 BMD of three different devices was significantly different among the three devices (0.01%, 0.78%, and 2.46% for Lunar, Hologic, and Osteosys, respectively).
In order to compare the BMD obtained from other measurement equipment or hospitals, a value with traceability through an ESP calibration is required. Therefore, the concept of uncertainty through instrument calibration with traceability combined with the LSC should be managed to account for the error in the BMD measurement.
This study has several limitations. First, to calculate the uncertainty, it applied only a representative process critical to Quality Control in the process of measuring the BMD. Using the uncertainty calculation formula provided, future studies will need to calculate the uncertainty with the standard values from all processes. Second, it was difficult to make a direct comparison, as there were few medical data for calculating the uncertainty. Since the importance for standard values and calculation of uncertainty are being emphasized in the medical and industrial sectors, these study findings will become increasingly more valuable.
In conclusion, the combined standard uncertainty of the spine BMD corrected with ESP was 0.015 when measured at one time and targeting one participant. The uncertainties of the accuracy of the IQC and the IP were higher than that of the other factors. Therefore, there will be a need for establishment of protocols to lower these uncertainties.
ACKNOWLEDGEMENT
This research was supported (in part) by Ministry of Trade, Industry and Energy through Standard Reference Data Program.
Notes
No potential conflict of interest relevant to this article was reported.


