


INTRODUCTION
Some metals such as zinc, iron, and copper are closely linked to human health because they are essential for maintaining normal physiological functions.[1] However, there are heavy metals produced as environmental pollutants that have adverse health effects. Environmental exposure to heavy metals can alter genes and increase disease susceptibility.[2] Exposure to heavy metals occurs through various routes, and quantifying absorbed doses is complex because of the levels of absorption and metabolism. In addition, exposure time duration varies widely among individuals. Meanwhile, polluted fresh water, soil, air, smoking, and food are known main routes of exposure.[3,4,5] The World Health Organization (WHO) has classified some heavy metals such as cadmium, lead, mercury, and arsenic as chemical pollutants that require close monitoring.[6]
Accumulations of harmful heavy metals in the human body alter hormone metabolism and cause blood vessels to constrict, which lead to adult diseases such as cancer and fetal growth restriction.[7] Such potential risks to public health pose a concern. Heavy metal concentrations have also been reported as a risk factor for fractures and degenerative diseases such as osteoporosis.[8] In particular, cadmium is the most widely known to have toxic effects on bones. Itai-itai disease is regarded as the most well-known musculoskeletal disorder caused by cadmium build up, first found in residents living around a cadmium-polluted river in Japan.[9,10] Lead also commonly exists in the environment, making it easy to be absorbed even without direct contact; about 80 mg of lead can accumulate in the body throughout a person's lifetime, mostly in the bones. Exposure to mercury, which is closely associated with lifestyles such as drinking, smoking, and occupation, affects the nervous system.[11] In Korea, studies have investigated the association between cadmium concentration and the incidence of fractures in an industrial region.[12] However, research on the association between heavy metals and bone health is lack.
Moreover, management of environmental factors for prevention and treatment of osteoporosis is highly important. Therefore, this study was conducted to identify the relationship between heavy metal concentrations in the body and bone density and various influential factors by using the results of the Korea National Health and Nutrition Examination Survey (KNHANES).
METHODS
1. Study subject
This study was based on the data from the KNHANES between 2008 and 2011. This is a nationwide cross-sectional survey composed of health interview, health examination, and nutrition surveys. Among the 37,753 initial subjects, subjects younger than 18 years (n=13,500), subjects without or missing bone density measurements (n=15,216), subjects without or missing heavy metal concentration (n=6,380), and subjects with missing variables (n=228) were excluded. The final analysis used the data from 2,429 subjects who were divided into the following three groups: normal (n=883), osteopenia (n=1,077), and osteoporosis groups (n=469). The survey was approved by the Institutional Review Board of Centers for Disease Control and Prevention in Korea (IRB No. 2008-04EXP-01-C, 2009-01CON-03-2C, 2010-02CON-21-C, 2011-02CON-06-C).
2. Variable measurements
Height and weight were measured to the nearest 0.1 cm and 0.1 kg using a portable stadiometer (SECA 225; Seca GmbH Co. KG., Hamburg, Germany) and a balanced scale (GL-6000-20; CAS, Seoul, Korea), respectively. Body mass index (BMI) was then calculated as weight (kg) divided by the square of height (m2). Blood specimens were collected by venipuncture and analysed by a laboratory certified by the Korea Ministry of Health and Welfare. Blood lead and cadmium were measured by the graphite furnace atomic absorption spectrometry using a analyzer (PerkinElmer AAnalyst 600; PerkinElmer, Turku, Finland) and blood mercury was measured by the gold amalgamation method using a analyzer (DMA-80; TRICELL, Milestone, Italy). Self-reported questionnaires were applied to determine age, sex, smoking, alcohol drinking, living area, educational level, occupation, and family income.
3. Variable definitions
The study subjects were categorized into three groups according to the minimum level of bone mineral density (BMD) measured by T-score from the total proximal femur, femur neck, or L1-L4: normal (T-score>-1.0), osteopenia (-2.5≤T-score≤-1.0), and osteoporosis (T-score<-2.5).[13] Cigarette smoking was defined as never, past, or current and alcohol drinking was defined as none, occasional, or frequent. The occasional alcohol drinking included those who drank less than once per week. Residential area was categorized according to the Korean administrative district as a rural or urban area. Educational level was categorized as less than a high school diploma, high school diploma, or college or higher. Occupation was divided into white-color (manager, professional level, office workers, service workers, sales), blue-color (agriculture, fishery, technicians, assemblers, simple labor), or none (students, housewife, unemployed). Family income was calculated by dividing the monthly household income by the square root of the household size and grouped into four quartiles (low, middle-low, middle-high, or high).
4. Statistical analysis
Complex sample analysis was performed to the national survey data using the weights, stratified variables, and cluster variables following the guidelines from the KNHANES to achieve results without biases. Weights were recalculated by combining weights of 4-year survey data. Continuous variables were reported as mean±standard deviation (SD), and categorical variables were reported as frequency (percentage). The group comparisons were performed using chi-square test and posthoc comparison using Bonferroni's correction. The linear trend of the smoking amount in current smokers according to the level of BMD measured by T-score was assessed by Jonckheere-Terpstra test. The level of blood heavy metal concentrations per characteristics were summarized as geometric means with 95% confidence intervals (CIs) by taking the antilog of the mean of the natural log-transformed values. The log-transformed blood heavy metal concentrations were fitted to the multiple linear regression including the all covariates considered. The proportional change and its 95% CIs were calculated by exponentiation of the coefficients. It means that the proportional change in the arithmetic mean associated with each level of the covariates relative to a reference level. Multiple logistic regression analyses were used to measure the association between the quartiles of blood heavy metal concentration and the presence of osteopenia or osteoporosis. Statistical analyses were performed using R (version 3.1.3; The R Foundation for Statistical Computing, Vienna, Austria) and a level of P<0.05 was considered as statistically significant.
RESULTS
1. Demographic factors of the participants
Our study subjects consisted of 2,429 Korean adults; 1,077 (44.3%) had the T-score ranged from -2.5 to -1 and they were categorized in the osteopenia group, and 469 (19.3%) had the T-score lower than -2.5 and were categorized in the osteoporosis group. Table 1 shows the demographic characteristics of the study subjects in three groups divided by the level of BMD. In the osteopenia or osteoporosis, the proportions of those aged ≥40 or the menopausal women were significantly higher than the normal group (P<0.001 in both). The current smoker or the frequent alcohol drinking were greater in the osteoporosis groups although they were not statistically significant. The smoking amount in the current smokers increased according to the level of BMD measured by T-score (P for trend =0.019). Living in the urban area or having the white color jobs were more common among subjects with no osteopenia or osteoporosis. The educational level and family income were more likely to be lower in subjects with osteopenia or osteoporosis than normal group (Table 1). The similar tendency was also shown when the subjects were divided into two groups such as normal vs. osteopenia or osteoporosis (Supplementary Table 1).
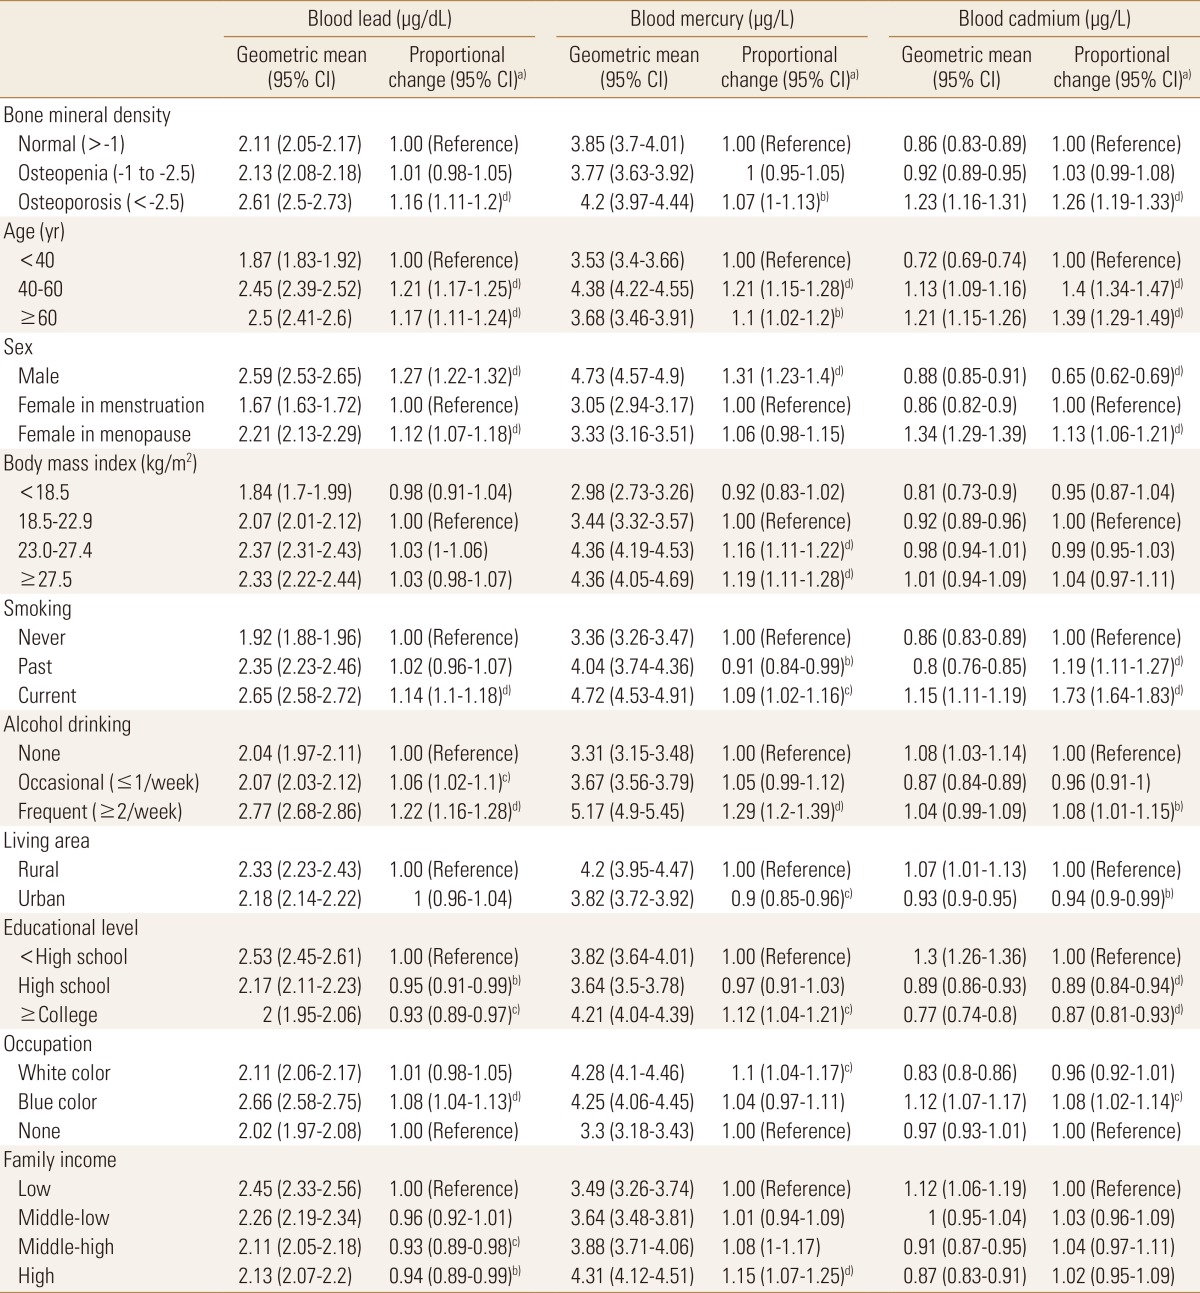
2. Distribution of blood heavy metal concentrations
To examine the effects of demographic characteristics on blood heavy metal concentration level, multiple linear regression analyses were conducted for the blood lead, mercury, and cadmium concentration level. Three of blood heavy metal values ranged 0.51 to 24.53 µg/dL for blood lead, 0.37 to 43.10 µg/L for blood mercury, and 0.11 to 8.35 µg/L for blood cadmium, respectively. The geometric mean blood heavy metal concentration varied according to demographic factors, as shown in Table 2 and Figure 1. Blood lead concentrations were highest in frequent alcohol consumer (2.77 µg/dL; 95% CI 2.68-2.86), followed by blue color job workers (2.66 µg/dL; 95% CI 2.58-2.75). Blood mercury concentrations were also highest in frequent alcohol consumer (5.17 µg/L; 95% CI 4.90-5.45), followed by male (4.73 µg/L; 95% CI 4.57-4.90) while blood cadmium concentrations were highest in the menopausal women (1.34 µg/L; 95% CI 1.29-1.39). Thoroughly, menopausal women, current smoking, frequent alcohol drinking, lower educational level and family income were associated with an increased blood heavy metal concentration levels (Table 2).
3. Risk of bone health according to the level of blood heavy metal concentration
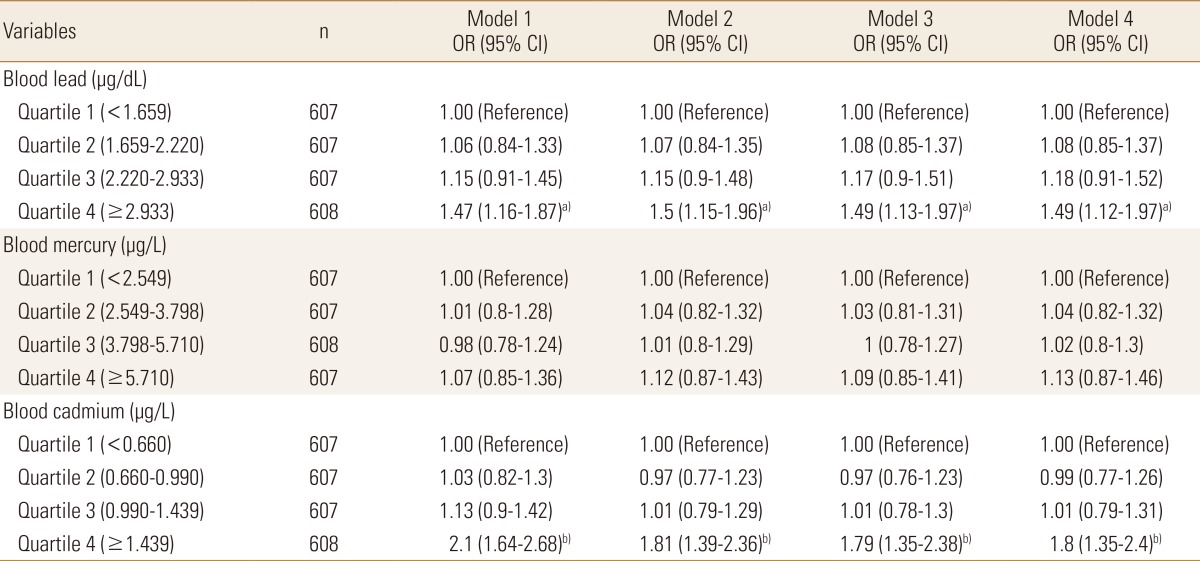
Logistic regression analyses were designed to figure out the prevalence of osteopenia or osteoporosis according to the quartiles of blood heavy metal concentrations. The risk for osteopenia or osteoporosis increased with an increasing blood lead or cadmium level significantly while the risk increased with an increasing blood mercury having no statistical significance. In case of blood lead, subjects in the highest quartile (≥2.933 µg/dL) had a 1.47 times (95% CI 1.16-1.87) risk of osteopenia or osteoporosis, compared with those in the lowest quartile (<1.659 µg/dL) in the crude model. After further multiple adjustment for age, sex, lifestyle behaviors, and sociodemographic factors, the odds ratios (ORs) were remained statistically significant (blood lead quartile 4: OR=1.49, 95% CI 1.12-1.97 compared with quartile 1). In case of blood cadmium, the risk for osteopenia or osteoporosis increased 2.1 times (95% CI 1.64-2.68) in subjects with the highest quartile of blood cadmium (≥1.439 µg/L) compared with the lowest quartile (<0.660 µg/L). After adjustment for the same factors in modelling blood lean previously, the ORs were attenuated but remained significant (blood cadmium quartile 4: OR=1.8, 95% CI 1.35-2.4 compared with quartile 1) (Table 3).
DISCUSSION
In this study, we performed an analysis to determine the risk of bone density reduction associated with heavy metal concentrations by investigating demographic characteristics, life habits, bone density distribution, and metal concentration levels. As a result, the variables associated with bone density included age, menopausal woman, educational level, occupation, and household income, all of which are consistent with existing findings in the literature.[14,15] Smoking amount in current smokers was significantly different between healthy and osteoporosis groups. Myong et al.[16] reported that smoking amount in menopausal women is negatively correlated with bone density and added to their analysis that high cotinine concentration in urine indicates heavy smoking and likely reduces bone density at the lumbar spine and femur.
When the mean concentration for each variable was compared with the analysis results of risks associated with concentration levels, the concentrations of lead, mercury, and cadmium were within the normal range by the WHO. However, the OR significantly increased in the osteoporosis group, compared with those in the normal group. Lead and cadmium were similar in that the OR were significantly increased in variables of older age, menopausal woman, smoking, frequent alcohol drinking, low educational level, and blue-color occupation. In the analysis of the risk associated with low bone density based on four concentration levels and adjusted variables, osteoporosis risk was positively correlated with concentration levels, increasing ORs to 1.49 and 1.8 times in lead and cadmium, respectively. A Swedish Women's Health in the Lund Area (WHILA) study reported that even low heavy metal concentrations can increase the risk of osteoporosis.[17] A Belgium study[18] also claimed that higher cadmium concentrations lead to lower bone densities. However, the mechanism involving the association between heavy metals and bone damage cannot be fully explained, although kidney damage was reported to be an important pathway for bone loss and that subsequent calcium malabsorption and iron deficiency in the body increases heavy metal absorption, which, if prolonged, causes proteinuria and consequent bone lesions.
This study has several limitations. First, since the data was collected in a cross-sectional design, a causal relationship between the level of body heavy metal concentration and the osteoporosis could not be clearly determined. Second, some factors such as the smoking and alcohol consumption were measured by self-reporting, it may result in a biased estimation of the association. Third, genetic characteristic and calcium supplement consumptions are important in the measurement of BMD, but they were not collected in the KNHANES. Thus, we could not determine how the associations between the level of blood heavy metal concentrations and the BMD may be changed by genetic factors and calcium supplement consumption. Nevertheless, there were several strengths in this study. This was a population-based national representative study that could control for several important confounding and mediating factors, including lifestyle and sociodemographic factors.
This study showed that blood heavy metals (lead and cadmium) associated low BMD. Thus, minimizing heavy metal exposure along with changes in diet, and life habits will help prevent osteoporosis. People who are exposed to heavy metals is also needed so that management has not decreased BMD. Further studies are needed to set the national permissible limits for exposure to heavy metals and to investigate the association between heavy metals and diseases. Further in-depth analysis is also needed based on the results of the variables found as significant risk factors in this study.


 PDF Links
 PubReader
 ePub Link
 Full text via DOI
 Full text via PMC
 Download Citation
 Supplement
 Print
Print