


INTRODUCTION
Of the osteoporotic fractures, especially hip fractures are a disease of which the social burden is high considering the economic loss and quality of life of patients.[1,2] Osteoporotic hip fractures have been increasing rapidly with age among the elderly aged 65 years or older. Accordingly, the incidence of osteoporotic hip fractures is expected to explosively increase for the next 30 years due to population aging in Asia.[3,4] Hip fractures are classified into two categories according to anatomical location, which include femoral neck fractures and intertrochanteric fractures. Although femur neck fracture and intertrochanteric fracture are considered as the same category as osteoporotic hip fractures, there are several distinctions: for example, the distribution of cortical bone and spongy bone, fracture patterns, treatment modalities and prognosis of fractures.[5] Out of clinical risk factors for hip fractures, a low bone mineral density (BMD) is known for the most sensitive predictor of fractures in several studies.[6,7] However, it has been reported in the study by Faulkner et al.[8] in 1993 that hip fractures may be predicted by simple measurement of the femoral geometry, and geometric risk factors predicting hip fractures regardless of BMD may exist. Since then, a great number of studies on cross-sectional area (CSA) and width of the femoral neck and hips axis length (HAL) have been reported, but different results have been shown depending on race, sex and age.[9,10,11,12] A large number of studies showed that in spite of lower hip BMD, the prevalence of hip fractures in Asians is relatively low compared with other races, due to differences in hip geometry among races.[13,14,15,16] However, studies on hip geometry for the elderly Asian women are very rare.[17,18] In the present study, we analyzed BMD and proximal femoral geometry between the femoral neck fracture group and intertrochanteric fracture group divided from women aged 65 years or more with osteoporotic hip fractures, and investigated proximal femoral geometric parameters affecting fractures. Furthermore, we attempted to identify whether these geometric parameters are independent risk factors for fractures regardless of BMD.
METHODS
1. Subjects
This study was conducted on 197 women aged 65 years or older who had osteoporotic hip fractures and were admitted to the orthopedics department in the Ajou University Hospital from March 2011 to May 2015. Subjects consisted of 84 patients with femoral neck fractures and 113 patients with intertrochanteric fractures. The following patients were excluded in this study: patients with fractures caused by high-energy injury such as a motor vehicle accident; patients with diseases affecting bone metabolism; patients with a history of drug use including steroid medicines, bisphosphonates and selective estrogen receptor modulators (SERMs); patients in non-ambulatory status pre-injury. Additionally, patients in which measurements of hip BMD and hip geometry are impossible due to fractures occurred in both hips were excluded. A retrospective study was conducted with the control group including 551 patients who were women over 65 years of age, and visited to the outpatient clinic for the treatment of osteoporosis during the same period.
2. Measurements
1) BMD
For all subjects, femur BMD was measured using dual energy X-ray absorptiometry (DXA; Lunar Prodigy Advance, GE Lunar, Medison, WI, USA). Measurement of BMD in the total femur and femoral neck was performed preoperatively, with the patient in the supine position and BMD for fracture patients was measured at the site without fracture within 10 days after injury. In the present study, total femur only was used for measurement of BMD.
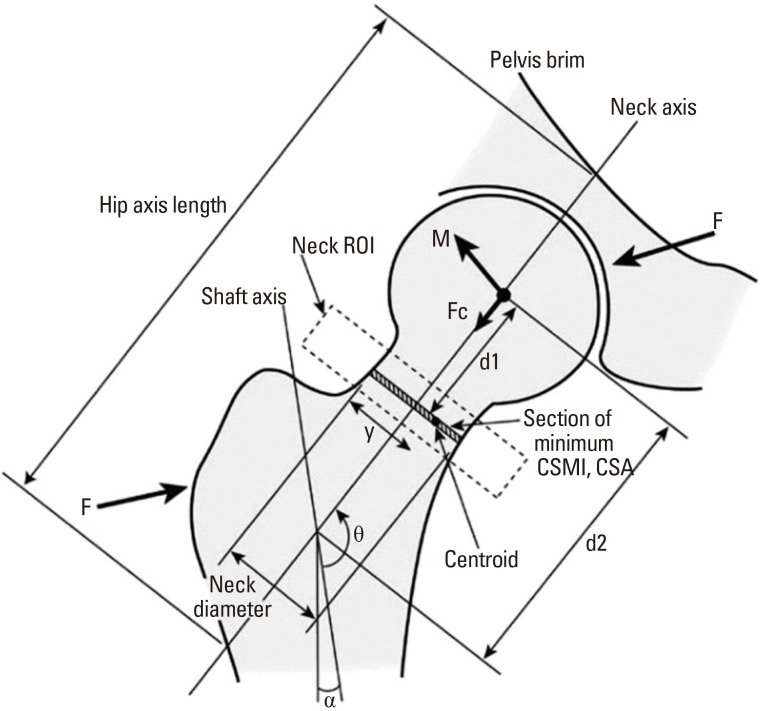
2) Proximal femoral geometric parameters
Proximal femoral geometric parameters were measured simultaneously along with measurement of BMD using DXA (the manufacturer's advanced hip assessment software package, GE Lunar). The geometric parameters included HAL, CSA of the femoral neck, distance along the neck axis from the center of the femoral head to the section of minimum CSA (D1), distance from the center of the femoral head to the shaft axis (D2), neck width and neck shaft angle (NSA) (Fig. 1).
3. Statistical analysis
The results of this study were obtained by comparing among three groups including the control group, femoral neck fracture group and intertrochanteric fracture group. Femoral geometric parameters associated with fractures were statistically analyzed using SPSS statistics program (SPSS version 22; SPSS Inc., Chicago, IL, USA). Statistic values for each analytical variable were represented as mean and standard deviation (SD). The independent samples t-test was used for comparing the mean and SD of two independent groups: i.e. between the control group and the femoral neck fracture group; between the control group and the intertrochanteric fracture group; between the femoral neck fracture group and the intertrochanteric fracture group. If the P-value is less than 0.05, we decide the results are statistically significant. Logistic regression analysis was used to obtain the odds ratio (OR) estimates for each variable, and the change in the OR associated with a one-unit change in the SD was represented.
RESULTS
Measurements of each variable in three groups are shown in Table 1. There were statistically significant differences in the age and weight, CSA/length/width of the femoral neck and BMD of the proximal femur between the control group and the femoral neck fracture group, as well as between the control group and the intertrochanteric fracture group. Age and weight in the control group were younger and heavier than in the fracture group. For the CSA and width of the femoral neck, the control group was larger and thinner, as compared to the fracture group. The femur BMD was higher in the control group than in the fracture group. No significant differences for HAL and NSA showed between the control group and the fracture group. The mean age for the control group was 73.81±5.55 years, 76.93±6.58 years for the femoral neck fracture group and 79.02±6.19 years for the intertrochanteric fracture group. The mean age was significantly lower in the control group than in the fracture group (P<0.001). BMD of the total femur in the control group was 0.76±0.12 g/cm2, and one in the femoral neck fracture group and the intertrochanteric fracture group was 0.65±0.12 g/cm2 and 0.61±0.10 g/cm2 respectively. The control group had significantly higher BMD in the total femur, as compared to the fracture group. There were no statistically significant differences between the two fracture groups. Femoral neck length (NL) in the control group and femoral neck fracture group was 46.61±4.69 mm and 44.20±5.98 mm separately, as a result, the femoral NL was statistically significantly higher in the control group (P<0.001). No statistical significance for the femoral NL was between the control group and intertrochanteric fracture group (P=0.722). The femoral NL between both fracture groups was statistically significantly shorter in the femoral neck fracture group (P=0.02).
The femoral neck width in the control group (31.03±1.96 mm) was statistically significantly thin, compared with the femoral neck fracture group (31.80±2.15 mm, P=0.006) and the intertrochanteric fracture group (31.82±2.34 mm, P=0.001). The OR of each variable were measured by logistic regression analysis. When adjusting age, weight and height, the OR for fractures in the femoral neck fracture group increased depending on a decrease of the femoral NL and CSA as well as femur BMD, along with an increase of the femoral neck width (OR 2.45, 1.70, 1.61, 2.27). In the intertrochanteric fracture group, the OR for fractures increased depending on a decrease of CSA in the femoral neck and femur BMD, along with an increase of the femoral neck width (OR 2.41, 1.45, 3.35) (Table 2). When adjusting age, weight, height and even BMD, in the femoral neck fracture group, the OR for fractures per SD decrease in CSA of the femoral neck increased by 1.97 times and 1.73 times per SD decrease in the femoral NL, regardless of BMD. The OR for fractures with a one SD increase in the femoral neck width increased by 1.53 times. In the intertrochanteric fracture group, the OR for fractures with a one SD increase in the femoral neck width increased by 1.45 times, independently of BMD (Table 3).
DISCUSSION
Hip fractures are classified into four major types according to anatomical location: femoral head fractures, femoral neck fractures, intertrochanteric fractures and subtrochanteric fractures. Osteoporotic hip fractures include femoral neck fractures and intertrochanteric fractures of the femur, because these fractures are relatively common in the elderly people. However, plenty of differences have been reported between femoral neck fractures and intertrochanteric fractures. In the present study, we attempted to analyze BMD and proximal femoral geometry in patients with the femoral neck fractures and intertrochanteric fractures, and investigate the proximal femoral geometric parameters affecting fractures. According to recent studies on differences between femoral neck fractures and intertrochanteric fractures, Fox et al.[5], has reported that patients with intertrochanteric fractures were older, worse in the pre-injury health status, slower in the rate of return after treatment and higher in the mortality rate at 2 months and 6 months after injury. Pulkkinen et al.[19], in the cadaveric biomechanical study, have reported that femoral neck fractures predominate at the lowest structural mechanical strength levels, whereas trochanteric fractures are more common at high failure loads and females are more susceptible to femoral neck fractures than males. Besides, changes in the femoral NSA has been reported to be important geometric parameters predicting the incidence of the two fractures. The study by Duboeuf et al.[20], has revealed that BMD of the two fracture groups was lower in the intertrochanteric fracture group, and a significant difference in HAL existed only in the femoral neck fracture group. However, Maeda et al.[21], has reported that there were no differences in BMD and HAL between both fracture groups and the femoral NSA was lower in the intertrochanteric fracture group. Panula et al.[22], has reported that no significant differences for the femoral NSA and NL were between the two fracture groups. In the present study, we found that age for the intertrochanteric fracture group was significantly higher, compared with the femoral neck fracture group (P=0.004), but no significant differences for BMD, HAL and NSA of the femur appeared between both fracture groups. The study by Compston et al.[23], suggested that the risk for hip fractures, clinical spine fractures and wrist fractures is inversely proportional to weight, and the risk for ankle fractures is directly proportional to weight. In the present study, the weight in the two fracture groups was significantly lower compared with the control group.
Factors affecting bone strength include BMD, macrostructure and microstructure of bone, mineral and collagen composition, and microdamage. In several studies, a low BMD is known for the most sensitive predictor of fractures, out of clinical risk factors for hip fractures.[6,7] However, it has been reported in the study by Faulkner et al.[8], in 1993 that hip fractures may be predicted by simple measurement of the femoral geometry, and geometric risk factors predicting hip fractures may exist, regardless of BMD. Broy et al.[24], in recent study based on several clinical results, has reported that HAL is associated with the risk of hip fractures in post-menopausal women, but there was insufficient evidence to prove such association in men. It has been reported that the femoral NSA is a predictor of hip fractures in post-menopausal women and men aged 65 years or older, while the role of the femoral NSA as an independent factor regardless of BMD is unclear because of insufficient evidence.[24] In particular, there are plenty of studies on HAL and the femoral NSA as an independent predictor of hip fractures risk, and most of these studies show that longer HAL is associated with an increase in the femoral neck fractures.[25,26,27,28,29] Some studies showed that a larger NSA is associated with an increase in fractures.[30,31] The study by Gnudi et al.[32], demonstrated that there appeared more significant differences for the proximal femoral geometry in the femoral neck fracture group, therefore, the femoral NSA along with BMD of the femoral neck could be an important predictor for fractures. According to the present study, statistically significant differences between the control group and the fracture groups including the femoral neck fractures and the intertrochanteric fractures were for the age and weight, CSA/length/width of the femoral neck and BMD of the proximal femur, however no significant differences were for HAL and the femoral NSA.
In the present study, we found that thicker femoral neck in both fracture groups could be a proximal femoral geometric parameter of an important factor of fractures risk. Of several studies on the femoral neck width, the study by El-Kaissi et al.,[33] has reported that post-menopausal women with hip fractures have thicker femoral neck and femur along with longer femoral NAL, as compared to women with no fractures. This results from compensatory change in bone geometry for a decrease in volumetric BMD.[34,35] But these results are not general. Pulkkinen et al.[19], has reported that the femoral neck width between both fracture groups had no significant differences, whereas Duboeuf et al.[20], has reported that the intertrochanteric fracture group had a significantly short width in the femoral neck. It has been presumed that different results among studies originated from differences in sex, age and race and measurement method. Plenty of studies explained that Asian people have lower hip BMD rather than other races, but nonetheless, the incidence of hip fractures in Asian population is relatively low due to differences of hip geometry among races.[13,14,15,16] Peacock et al.[35], in a comparative study of Black and White Americans, has reported that BMD was lower in White Americans. In comparing differences between men and women of the same race, BMD and hip geometry has been reported to be higher and smaller in women, because of differences in bone size depending on sex. The study by Kim et al.[12], which is on differences in femoral geometry depending on age and race, has shown that a marked decrease in trabecular volumetric and width of cortical bone with age appeared in Asians. The prevalence of hip fractures in Asians has been reported to be lower because Asians had thicker cortical bone and lower buckling ratio, as compared with other races. Kaptoge et al.[30], has reported that an increase in the width of proximal femur along with a decrease in the width of cortical bone were seen in men and women aged more than 65 years, but progression was significantly faster in women than men. A study of hip geometry for elderly Asian women is uncommon. Wang et al.[36], who studied ethnic differences in young women, has reported that no ethnic differences was observed in HAL among women, whereas HAL among men was shorter in Asian and Black than in White. Yan et al.[37], who examined ethnic differences in men and women aged 55 to 77 years, has reported that a short HAL and NL in the Chinese men and women could be an independent factor contributing to the lower incidence of hip fractures in comparison with Caucasian men and women. The study by Im and Lim [17], which was conducted on 100 elderly men and women in Korea and by comparing between the two fracture groups, has reported that the femoral NSA and HAL were significantly greater in the patients with intertrochanteric fracture group than control patients. It has been reported by Li et al.[18], that there has no significance for HAL and the femoral NSA in the hip fracture group, but a reduction in BMD and CSA of the femoral neck along with width of cortical bone were significantly observed. It has been presumed that different results of these studies conducted on Asians were caused by differences in the measurement method, age and a small number of subjects.
In the present study, the OR of each variable after adjustment for age, weight and height were measured. In the femoral neck fracture group, a decrease of the femoral NL and BMD with CSA of the femoral neck, and an increase of the femoral neck width were associated with the increase in the OR of fractures (OR 2.45, 1.70, 1.62, 2.27). In the intertrochanteric fracture group, a decrease of CSA in the femoral neck and the femoral BMD, and an increase of the femoral neck width were associated with the increase in the OR for fractures. We found that femoral neck fractures are affected more by proximal femoral geometry and intertrochanteric fractures are affected more by BMD. When measuring the OR of each variable after adjustment for age, weight, height and BMD of the total femur, in the femoral neck fracture group, the OR for fractures per SD decrease in CSA of the femoral neck and NL increased by 1.97 times and 1.73 times respectively, regardless of BMD, and the OR for fractures per SD increase in the femoral neck width increased by 1.53 times. In the intertrochanteric fracture group, the OR for fractures per SD increase in the femoral neck width increased by 1.45 times, independently of BMD. We found that an increase of the femoral neck width could be proximal femoral geometric parameters which played roles as an independent factor of fractures in either fracture groups, regardless of BMD.
This study has several limitations as follows; the study design is cross-sectional and retrospective design, selection bias in control patients because who actively concerns for their health, we used 2-dimensional DXA program so minor measurement error could occur.
In conclusion, we found that the femoral neck width could be proximal femoral geometric parameters which play roles as an independent risk factor of fractures, regardless of BMD. Additionally, it has been found in the present study that femoral neck fractures was affected more by proximal femoral geometry, whereas intertrochanteric fractures was affected more by BMD.


 PDF Links
 PubReader
 ePub Link
 Full text via DOI
 Full text via PMC
 Download Citation
 Print
Print