


INTRODUCTION
Sarcopenia had its own the International Classification of Diseases, Tenth Revision, Clinical Modification (ICD-10-CM). The assigned code was M62.84, which has been available for use since 2016. Recently, many studies related to sarcopenia have been reported during the last decades.
As one possible mechanism of sarcopenia that would explain the decrease of muscle mass, a deficit between protein synthesis and its degradation has been considered to be an important causal factor that results in malnutrition.[1] In fact, malnutrition is frequently found in various patient populations, particularly older adults, and in medical conditions, such as in patients with sarcopenia.[2] Sarcopenia studies have focused on metabolic diseases, such as diabetes, obesity, and cachexia, and on some specific diseases, including chronic renal failure, congestive heart failure, and chronic obstructive pulmonary disease. Of them, osteosarcopenia and sarcopenic obesity are representative type of sarcopenia.[3,4] Several studies have reported that patients with malnutrition and sarcopenia were associated with increased morbidity, increased infection, and high rates of falls and disability.[5-8]
Although pharmacologic intervention in patients with sarcopenia have been introduced, many medications are currently undergoing clinical trials. Only nonpharmacological intervention, including exercise and nutritional supports, are currently available and have reported successful outcomes.[9-12] Now, estimation of nutritional status is most important for successful treatment of sarcopenia. However, the nutritional status of patient with sarcopenia has not been sufficiently studied. In addition, the nutritional status depending on the type of sarcopenia, including osteosarcopenia and sarcopenic obesity, have not been evaluated. Therefore, our purpose in this study was to evaluate any deficiency of protein intake for the different type of sarcopenia and to establish a cut-off value for the relationship between malnutrition, sarcopenia, and osteosarcopenia.
METHODS
1. Participants
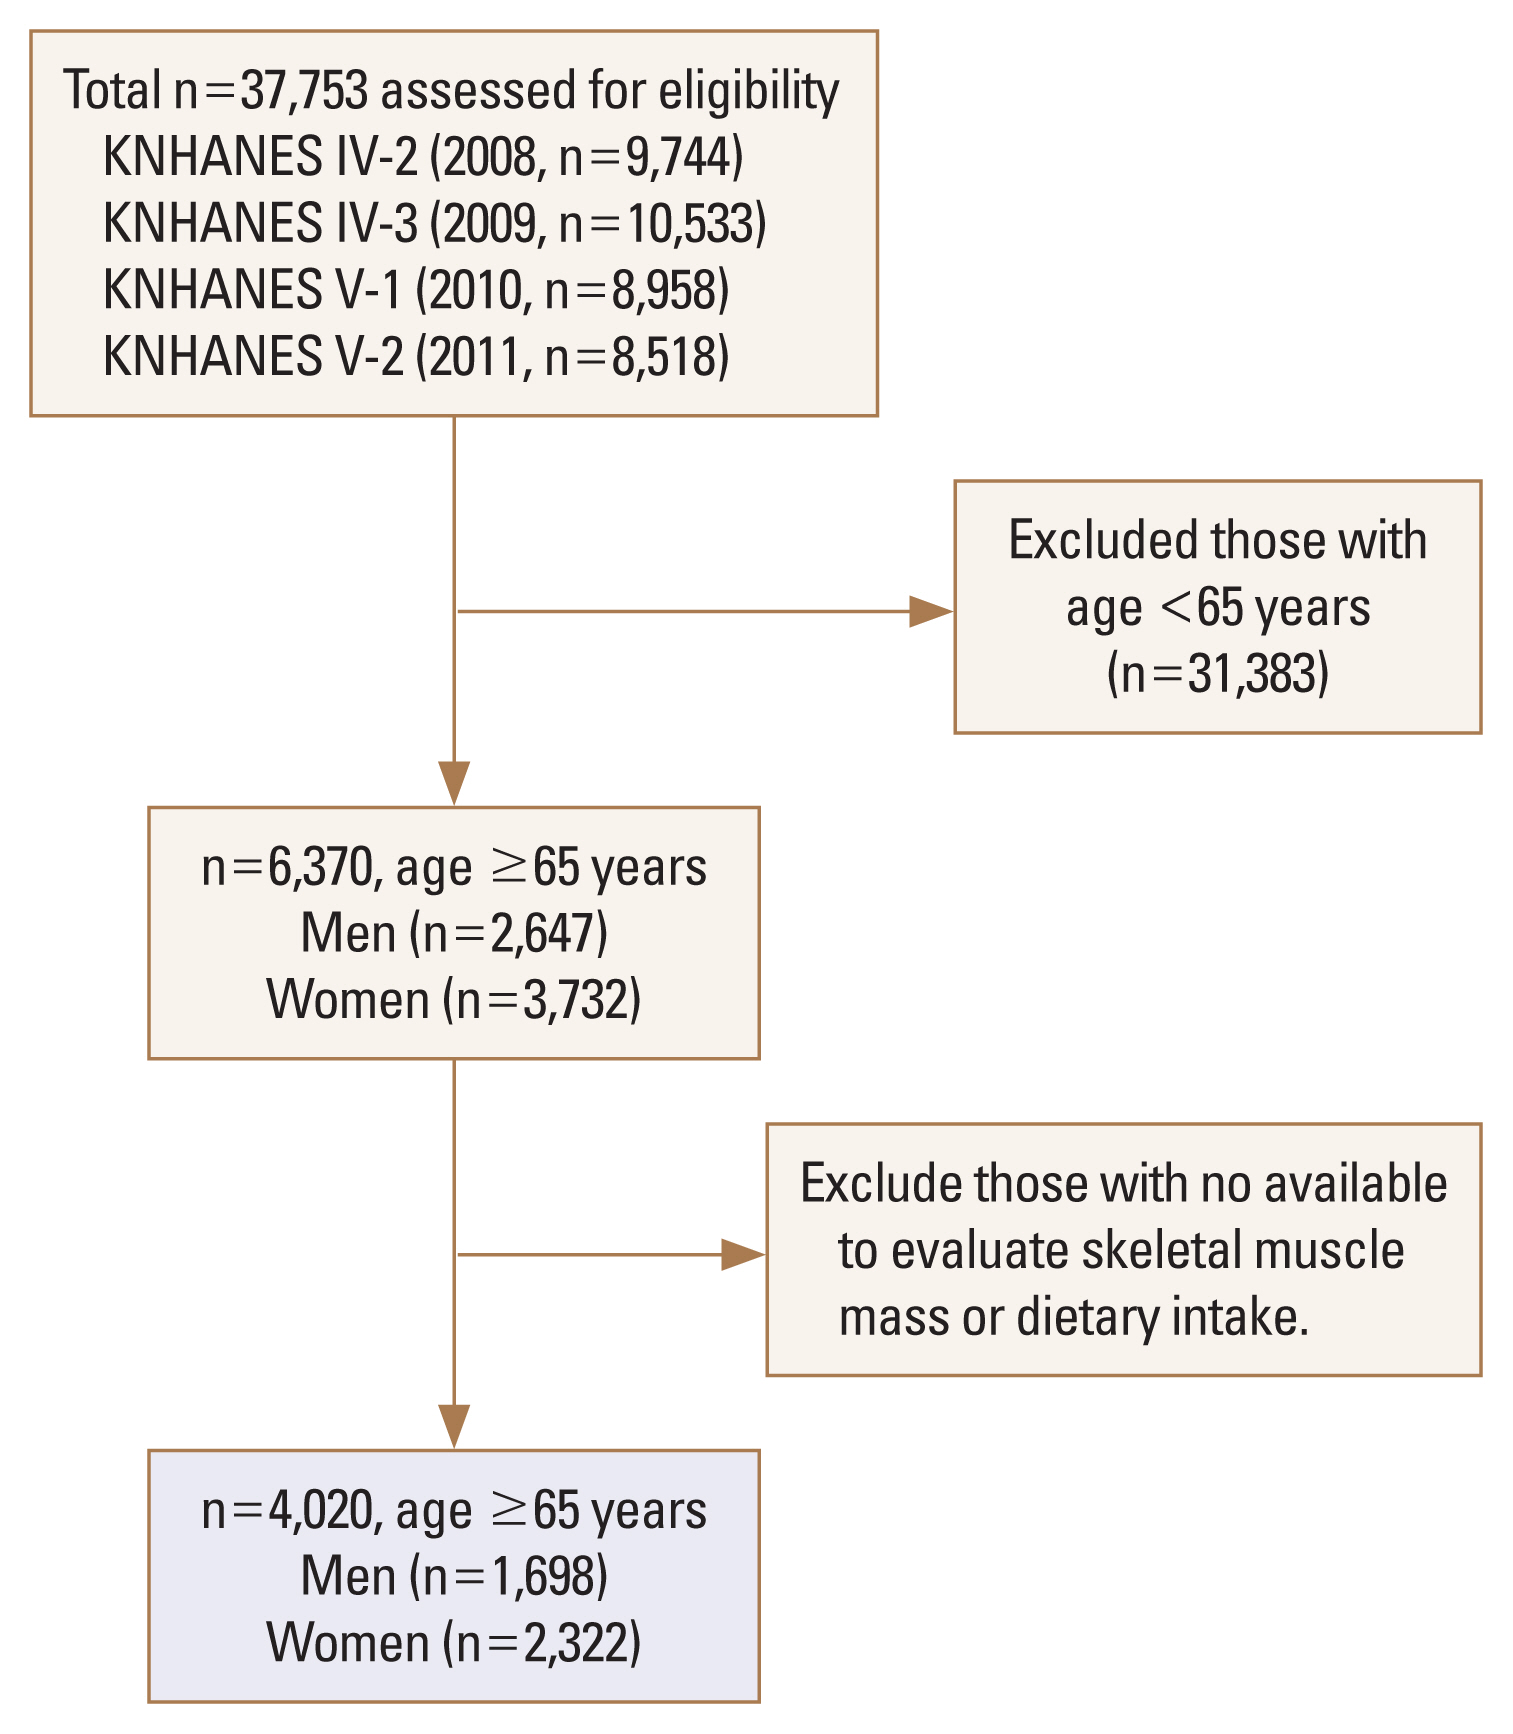
This study was based on data from the 2008 to 2011 Korea National Health and Nutrition Examination Survey (KNHANES), which was conducted by the Korean Ministry of Health and Welfare. KNHANES has been a nationwide representative cross-sectional survey for the Korean population with a clustered, multistage, stratified, and rolling sampling design. KNHANES consists of 3 sections: a health interview, a health examination, and a dietary survey. The survey data is collected via household interviews and by direct standardized physical examinations conducted in specially equipped mobile examination centers. The data was collected from 37,753 participants from survey years 2008 (n=9,744), 2009 (n=10,533), 2010 (n=8,958), and 2011 (n=8,518). Participants were excluded if they were under the age of 65, or if data were not available to evaluate skeletal muscle mass or dietary intake. After these exclusions, we analyzed a total of 4,020 participants (men, 1,698 and women, 2,322) for this study (Fig. 1).
2. Health examination survey
A health questionnaire was used to obtain information on age, gender, income (% of highest quartile), education status (% of more than middle-school graduation), smoking status (current or non-current smoker), moderate physical activity, and walking activity (yes or no). Moderate physical activity was defined as 5 or more days of moderately intense activity for at least 30 min/day. Walking physical activity was defined as 5 or more days of walking for at least 30 min/day. Body weight and height were measured in light clothing with no shoes, and body mass index (BMI) was calculated as weight (kg) divided by height squared (m2). Information about comorbidities, including diabetes, chronic obstructive pulmonary disease, chronic renal failure (CRF), and malignancy, as potential confounding factors were examined by means of the health interview survey.
3. Dietary intake variable
Dietary intake was assessed by trained staff using a complete 24-hr recall method. Daily intake of energy, carbohydrates, fat, and protein was calculated by referencing nutrient concentrations in foods according to the Korean food composition table.[13]
4. Nutrient adequacy ratio (NAR)
To evaluate the adequacy of protein intake, the NAR was used. The amount of protein consumed as food was divided by the daily recommended protein amount (50 g/day) of Korean males; the result was defined as NAR. In NAR, 1.0 was set as the highest upper limit; values above 1.0 were treated as 1.0, whereas values below 1.0 were used as they were.
5. Body composition
Body composition in the KNHANES was measured by whole-body dual energy X-ray absorptiometry (DXA; QDR 4500A; Hologic Inc., Bedford, MA, USA). All subjects changed into paper gowns and were asked to remove all jewelry and other personal effects that could interfere with the DXA examination. To obtain accurate and reliable results, all data regarding body composition were gathered by educated and quality controlled sarcopenia examination surveyors.[14] Bone mineral content, fat mass, and lean soft-tissue mass were measured separately for each part of the body, including the arms and legs. The lean soft-tissue masses of the arms and legs were nearly equal to the skeletal muscle mass. As absolute muscle mass correlates with height, the skeletal muscle mass index (SMI) was calculated by the following formula: (lean mass [kg]/height [m2]), which is directly analogous to BMI (BMI= weight [kg]/height [m2]). Arm SMI was defined as (arm lean mass [kg]/height [m2]). Leg SMI was defined as (leg lean mass [kg]/height [m2]). Appendicular SMI was defined as the sum of the arm and leg SMIs. Sarcopenia was defined according to the criteria for the Asian Working Group for Sarcopenia (AWGS; SMI of below 5.4 kg/m2 in women and below 7.0 kg/m2 in men).[15] Osteoporosis was defined as a BMD 2.5 standard deviations below the peak bone mass of a young, healthy, gender- and race-matched reference population according to the World Health Organization diagnostic classification. The cut-off point of BMI for obesity was greater than or equal to 25 kg/m2 on the basis of the Asian Pacific criterion. Osteosarcopenia was defined as the co-presence of sarcopenia and osteoporosis. Sarcopenic obesity was defined as the co-presence of sarcopenia and obesity.
6. Statistical analysis
We used complex sample analyses in this study to correct for the distributions of the cluster samples regarding the primary sampling unit, covariance, and significance to correspond with those of the general Korean population. The target population for the sampling procedure in the KNHANES was residents of Korea. However, residents of nursing homes, military facilities, and prisons were excluded. In order to improve the accuracy of the nationwide representative data, the sample design was carried out in a 3-year cycle (according to the time of year). Also, a survey of household members was conducted for the sample area, and the number of residential households was extracted by means of the sample design. We selected 20 households as the sample size. All analyses were carried out with the sample weights of KNHANES.
A rolling sampling survey is one in which independent rolling samples (n=F), not overlapping with the entire sample, are established and compared. In this case, each rolling sample was extracted in such a way that the probability distribution should be the sampling ratio of f=1/F for the entire sample. Therefore, at the time of passing the Fth cycle, the accumulated samples surveyed for the entire time will be organized into a sample survey for the entire population.
Protein intake adjusted body weight (g/kg) was categorized separately as follows: Men (Q1<0.67, 0.67≤Q2 <0.90, 0.90≤Q3<1.22, Q4≥1.22) and Women (Q1<0.53, 0.53≤Q2<0.75, 0.75≤Q3<1.02, Q4≥1.02). Low dietary protein was assumed to be less than 55 g/day for men and less than 45 g/day for women according to the recommended nutritional value of Koreans.[16]
The Student’s t-test and the χ2 test were performed to compare means and proportions between each group. Receiver operating characteristic curve were used to determine the cut off values of protein intake for sarcopenia and osteosarcopenia. All statistical tests were 2-tailed, and statistical significance was defined as P less than 0.05. The statistical calculation was performed using SPSS Statistics version 22 (SPSS Inc., Chicago, IL, USA).
RESULTS
1. Characteristics of elderly Korean population older than 65 years by presence of sarcopenia
In the elderly men, age (P=0.006), moderate physical activity (P=0.043), CRF (P=0.01), and malignancy (P< 0.001) were significantly higher in the sarcopenia group than in the normal group. Although the levels of parathyroid hormone and alkaline phosphatase were significantly higher in the sarcopenia group, the vitamin D and hemoglobin levels were significantly lower. In the elderly women, age was significantly higher in the sarcopenia group than in the normal group (P<0.001). However, BMI (P< 0.001), appendicular SMI (P<0.001), hemoglobin (P<0.01), and triglyceride (P=0.01) were significantly lower in the sarcopenia group than in the normal group (Table 1).
2. Dietary intake of total energy, carbohydrates, fats, and proteins by presence of Sarcopenia
In the elderly men, total energy (P<0.001), carbohydrates (P<0.001), fat (P=0.001), total protein (P<0.001), and low dietary protein intake (P<0.001) were significantly lower in the sarcopenia group than in the normal group.
In elderly women, total energy (P<0.001), carbohydrates (P<0.001), fat (P=0.009), total protein (P<0.001), and low dietary protein intake (P=0.046) were significantly lower in the sarcopenia group than in the normal group (Table 2).
3. Dietary intake of total energy, carbohydrates, fats, and proteins by presence of osteosarcopenia
In the elderly men, total energy (P<0.001), carbohydrates (P<0.001), fat (P<0.001), total protein (P<0.001), and low dietary protein intake (P<0.001) were significantly lower in the osteosarcopenia group than ln the normal group.
In elderly women, total energy (P<0.001), carbohydrates (P<0.001), fat (P<0.001), total protein (P<0.001), and low dietary protein intake (P=0.01) were significantly lower in the osteosarcopenia group than in the normal group (Table 3).
4. Dietary intake of total energy, carbohydrates, fats, and proteins by sarcopenic obesity vs. osteosarcopenia
In the elderly men, total energy (P=0.042), fat (P=0.015), total protein (P=0.037), and low dietary protein intake (P=0.029) were significantly lower in the osteosarcopenia group than in the sarcopenic obesity.
However, none of the variables of dietary intake in the elderly women were significantly different between the osteosarcopenia group and the sarcopenic obesity (Table 4).
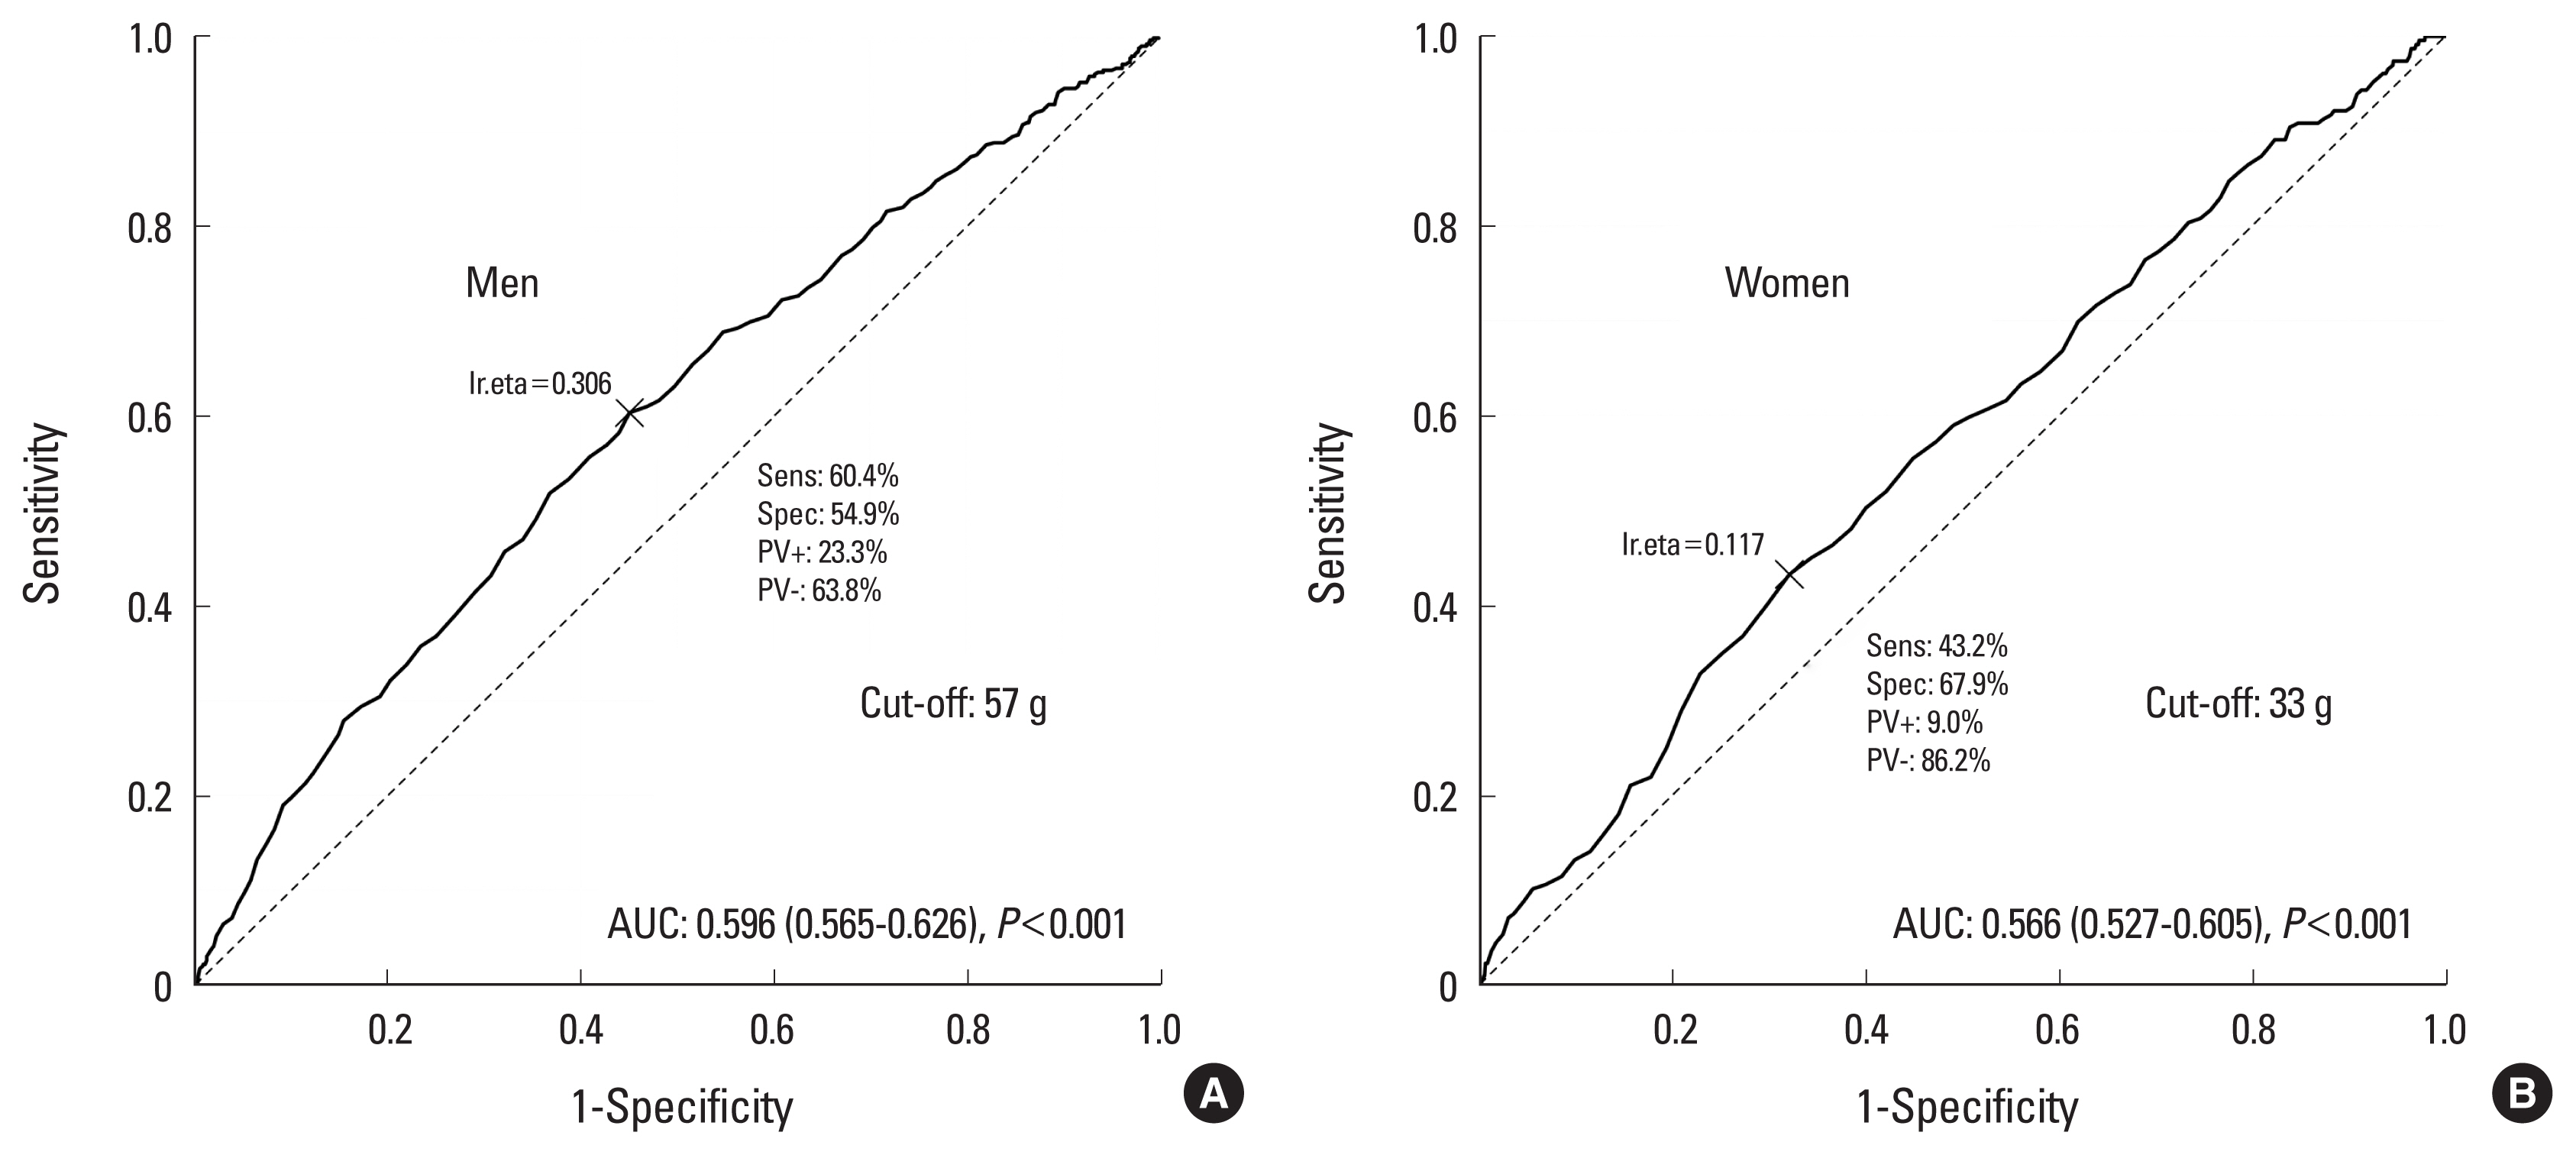
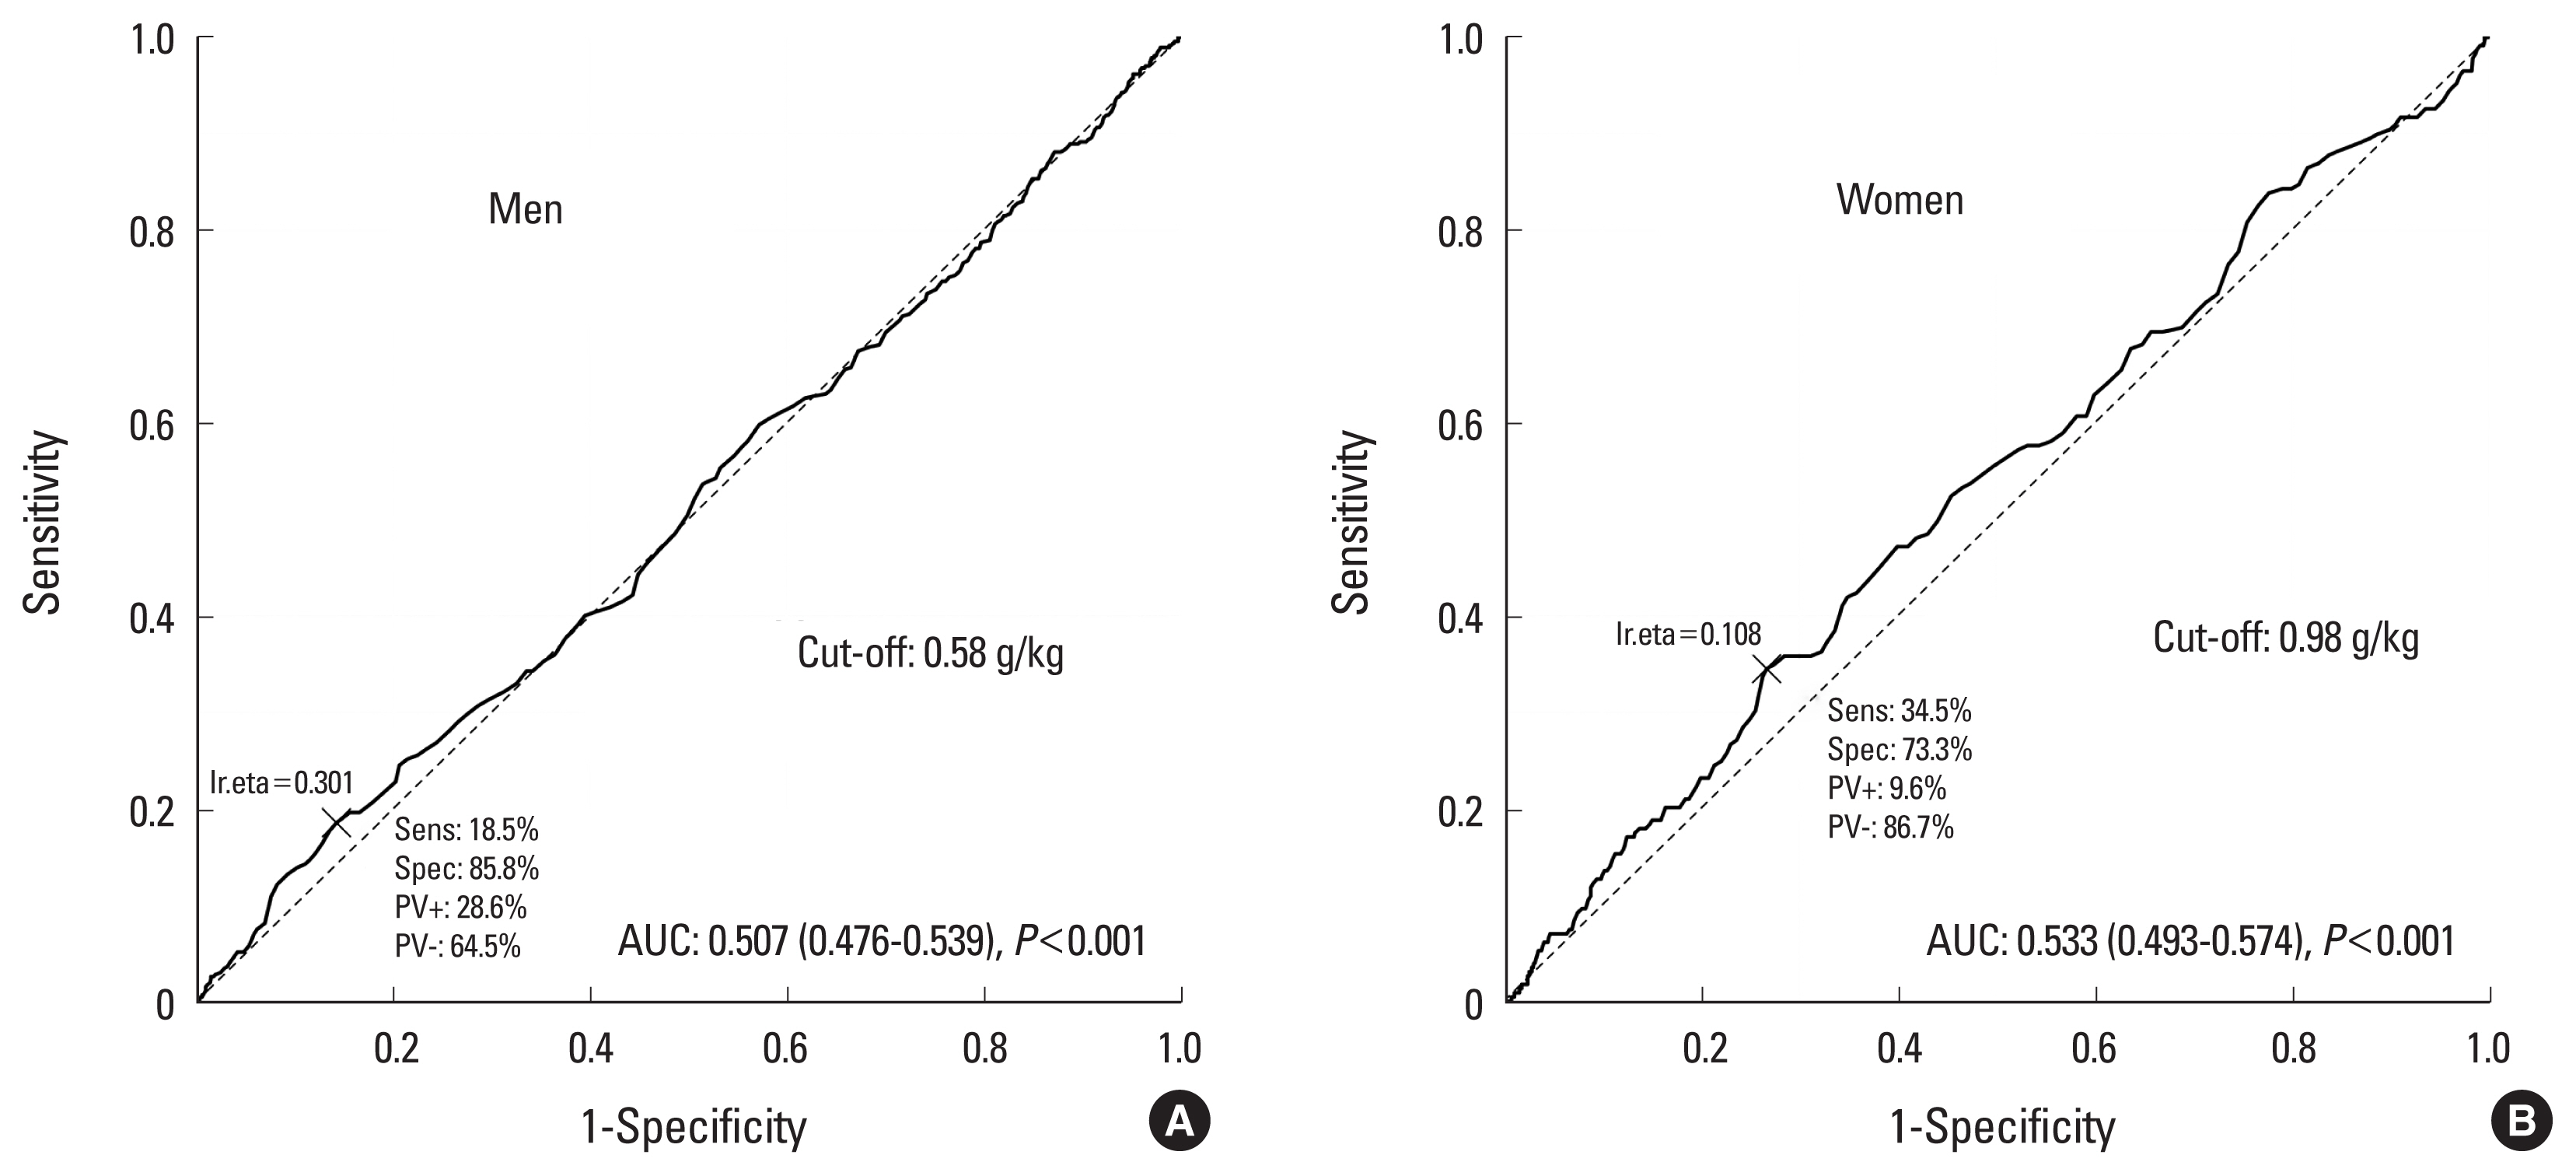
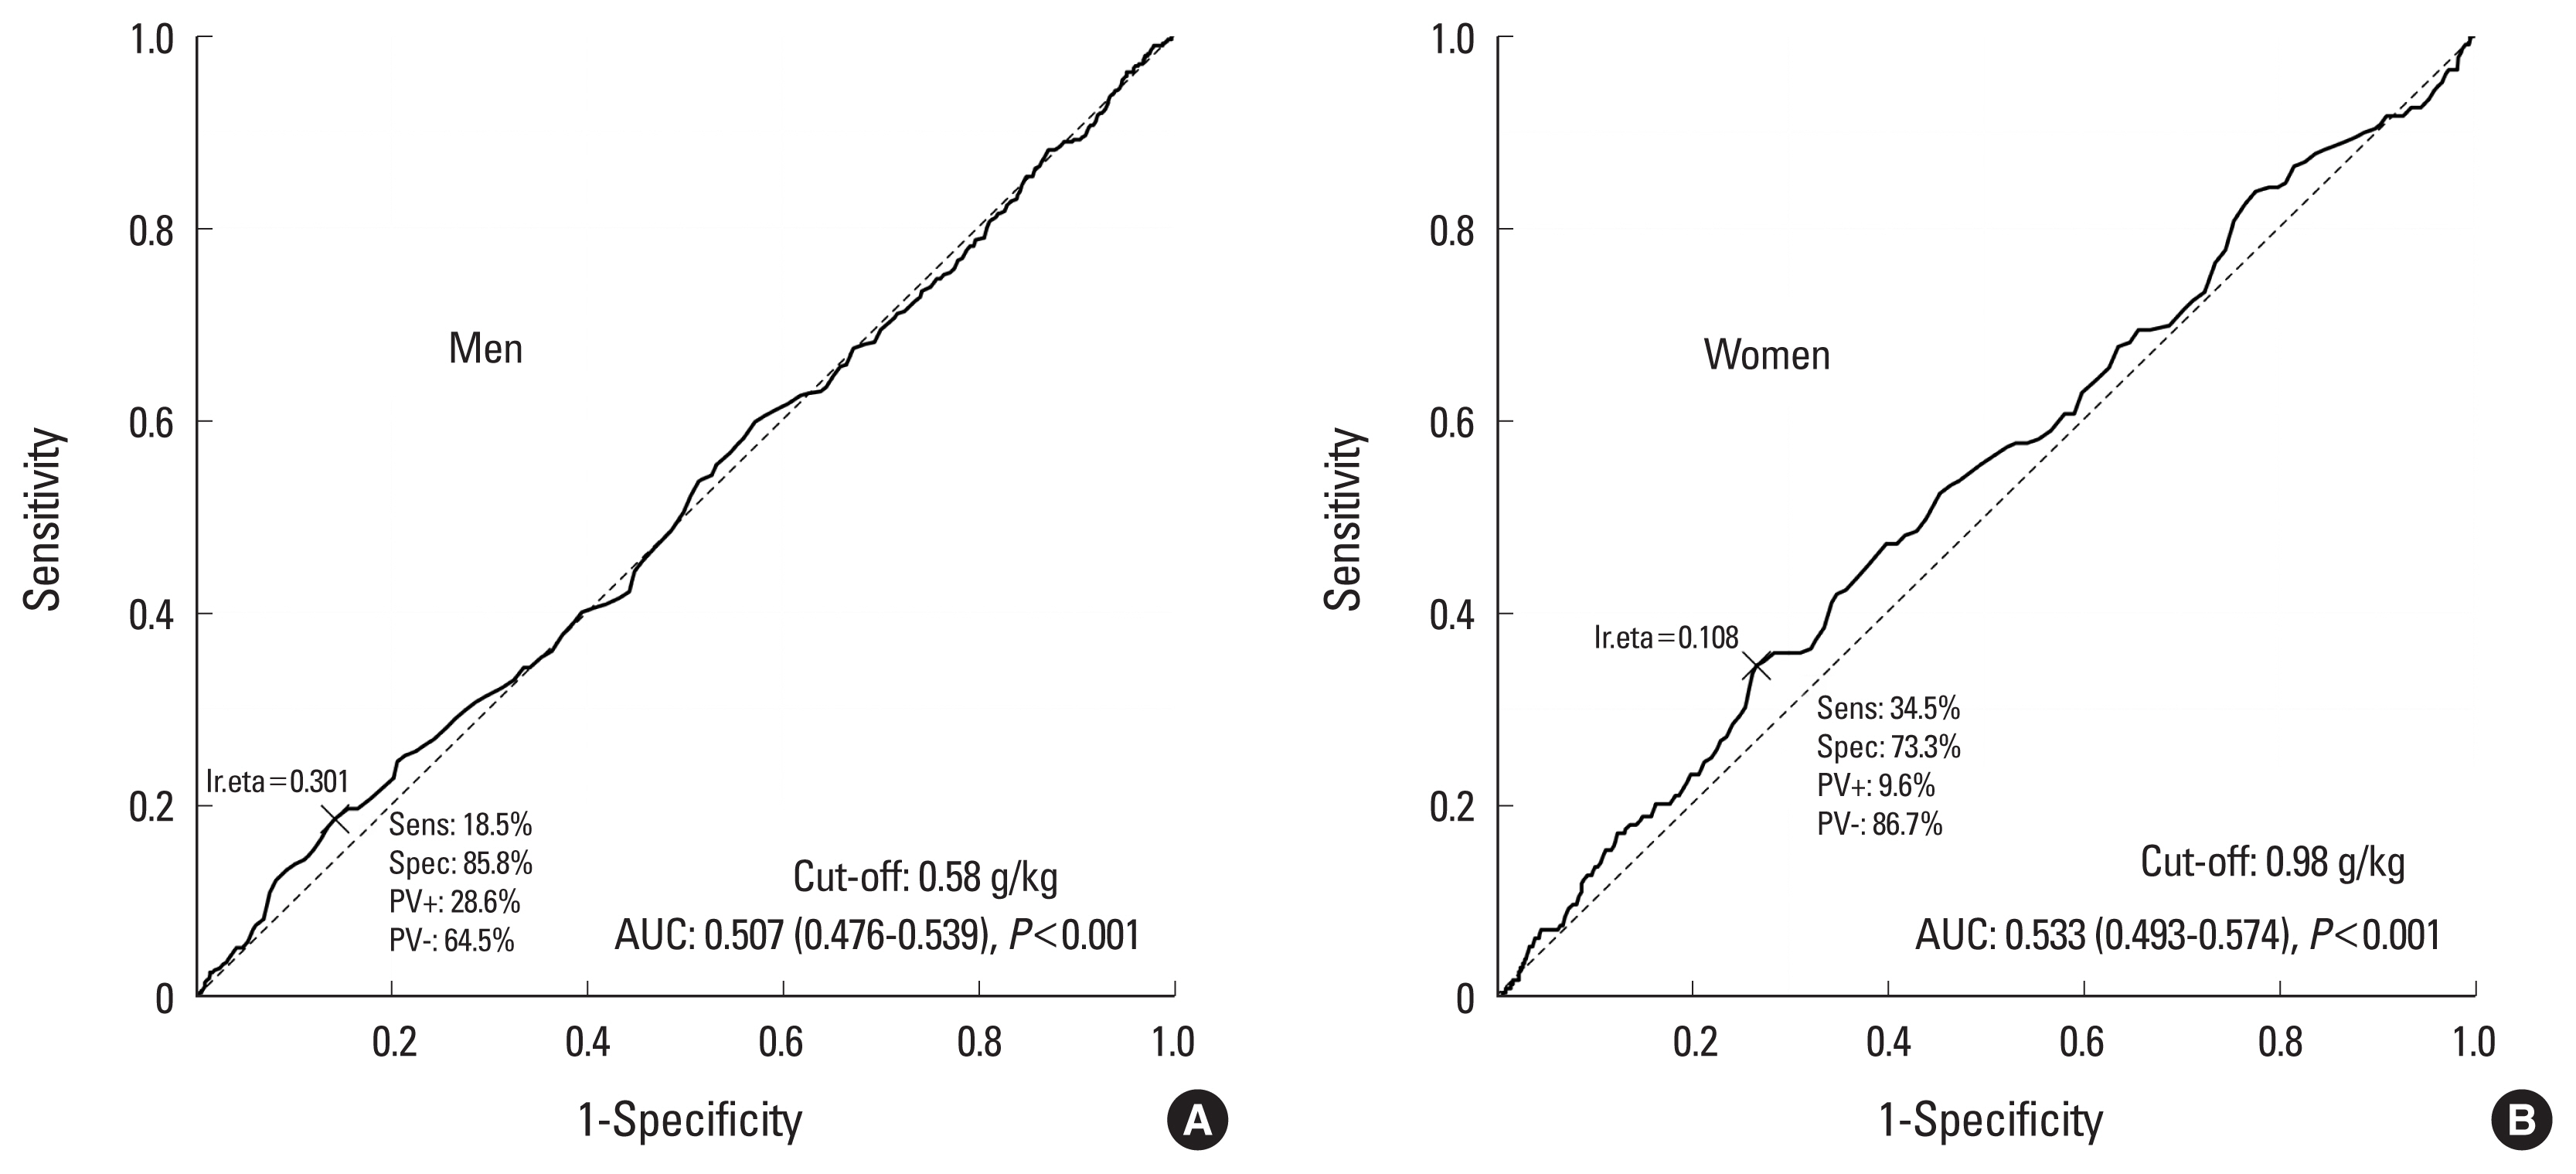
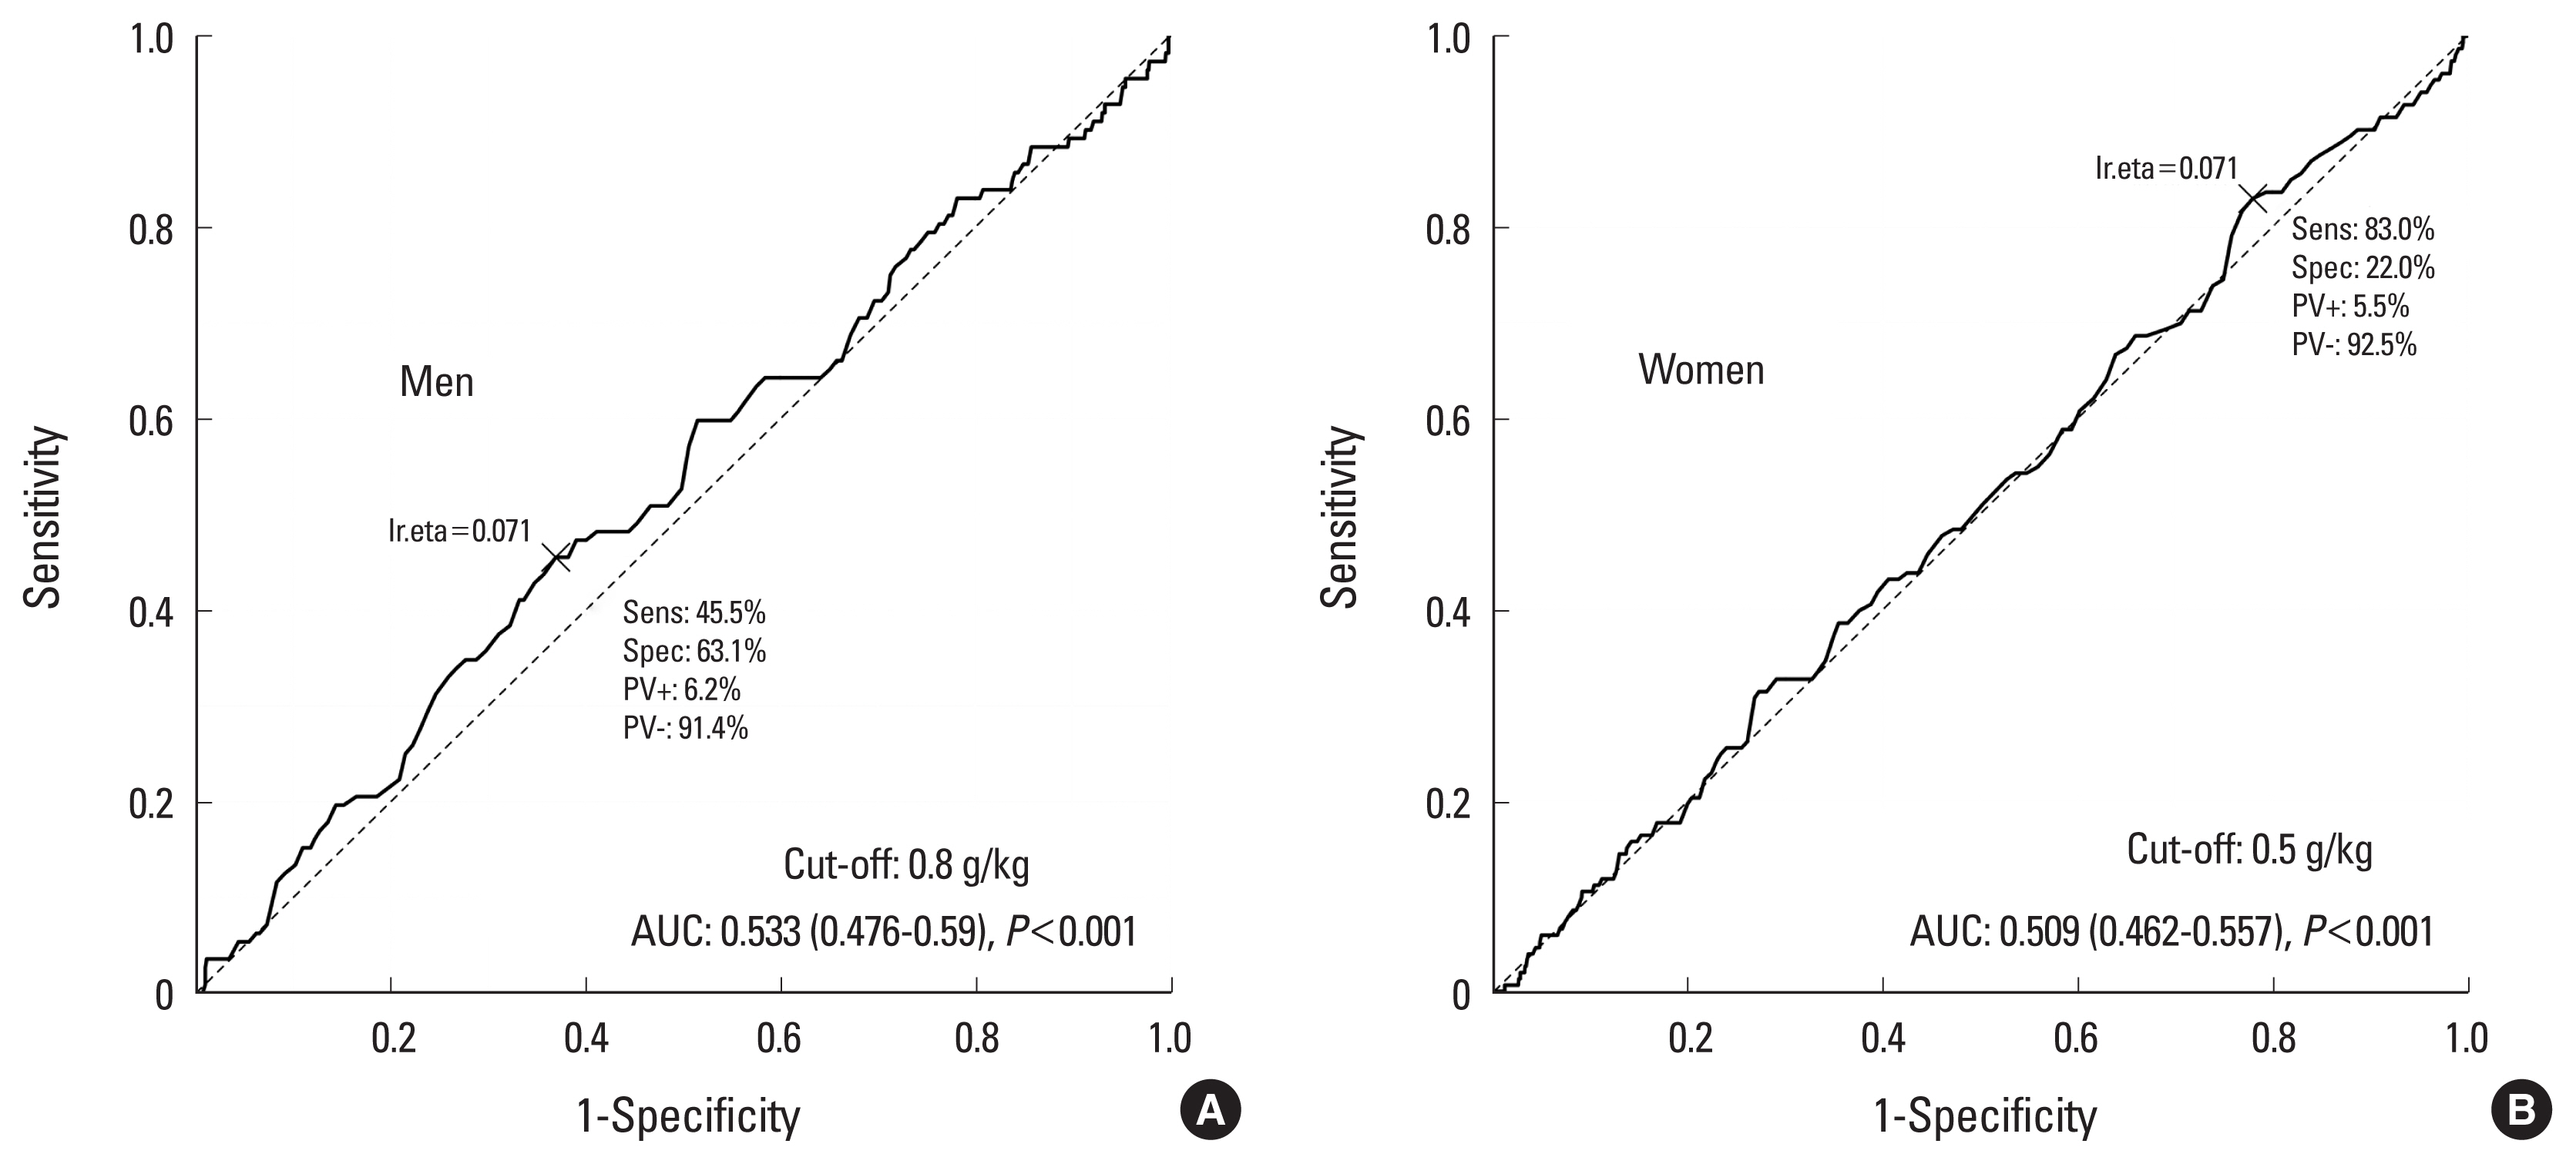
5. Cut off value of protein intake for sarcopenia and osteosarcopenia
The cut-off value for protein intake for sarcopenia was 57 g/day in men and 33 g/day in women (Fig. 2). The cut-off value of protein intake for osteosarcopenia was 54 g/day in men and 39 g/day in women (Fig. 3). The cut-off value of the adjusted weight of protein intake for sarcopenia was 0.58 g/kg/day in men and 0.98 g/kg/day in women (Fig. 4). The cut-off value of the adjusted weight for protein intake for osteosarcopenia was 0.8 g/kg/day in men and 0.5 g/kg/day in women (Fig. 5).
DISCUSSION
This descriptive observational study demonstrated a relationship between malnutrition and sarcopenia. Comparing gender-specific demographic characteristics, both genders in sarcopenia were older. BMI and appendicular SMI were lower only in women with sarcopenia. However, medical comorbidity was more prominent in men with sarcopenia. The principal findings are that total energy, carbohydrates, fat, total protein and dietary intake protein in both genders with sarcopenia and osteosarcopenia were significantly lower than in normal populations. In this study, the cut-off points for the protein intake of men and women for osteosarcopenia were 0.8 and 0.5 g/kg/day, respectively. However, this is not a reference result for the minimum recommended amount of protein and should be interpreted only as a cut-off point that increases the risk of osteosarcopenia. In addition, an analysis comparing sarcopenic obesity is not possible with the design of this study and will have to be done with additional samples and detailed nutritional assessment in the future.
In present study, both genders of sarcopenia and osteosarcopenia had lower dietary energy intake and total energy. Despite studies of the relationship between lower protein intake and sarcopenia, this finding is consonant with previous studies. Huang et al. evaluated the association between pre-sarcopenia status and lower protein intake using a population of 327 community-dwelling elderly. They found that participants with diets in the lowest quartile of total protein density were at 3.3 times higher risk for low muscle mass.[17] Several longitudinal studies demonstrated that adequate dietary protein maintains lean mass and strength in elderly populations.[16,17]
Osteosarcopenia and sarcopenic obesity are most commonly studied. Although diagnostic Osteosarcopenia and sarcopenic obesity are the most commonly studied. Although the diagnostic definitions of the 2 representative types of sarcopenia are similar, etiologic factors might differ between the 2 types. Especially sarcopenic obesity is more related to metabolic syndromes and more commonly occurs in patients with diabetes. However, osteosarcopenia is mostly related to the elderly population with osteoporosis. In subgroup analysis, we found that poor dietary protein intake was more related to osteosarcopenia in this study. Although Oh et al. [18] reported that the sarcopenic-obesity group was lower in physical activity, protein intake, and vitamin D level, they did not compare them with the osteosarcopenic group. Our findings are commonly found in patients with hip fractures, which are known to be a key phenotype of sarcopenia and osteosarcopenia. Poor protein intake and malnutrition are frequently accompanied in patients with osteosarcopenia. In this group, nutritional status should be evaluated, and nutritional support was proven to improve functional outcomes.[19,20]
This study has several limitations. First, the criteria for diagnosing sarcopenia were applied as in the previous the AWGS guideline. Given the limitation of the KNHANES data, which include only skeletal muscle mass, we analyzed protein intake by applying the diagnostic criteria for presarcopenia. Further research will require analysis of protein intake by the AWGS-II, which includes grip strength and physical performance.
Second, protein and nutrient intake were evaluated using only the self-reported questionnaire. In particular, in the elderly group, questionnaire nutritional assessment including 24-hr recall may not be accurate. In the near future, it should be accurately evaluated using nutritional values measured by means of community cohort and hospital cohort studies. Third, analysis and meaning could not be given, because the number of groups overlapping the 3 diseases (osteoporosis+sarcopenia+obesity) in common was small. Further analysis of the nutritional status of patients with all 3 diagnostic categories by means of different cohorts is required. Finally, the sarcopenia obesity group is too small to find significance compared to the osteosarcopenia group.
In conclusion, a comprehensive dietary assessment for the detection of nutritional deficits that predispose to or aggravate muscle atrophy is important for establishing a treatment plan for patients with malnutrition.
 PDF Links
 PubReader
 ePub Link
 Full text via DOI
 Full text via PMC
 Download Citation
 Print
Print